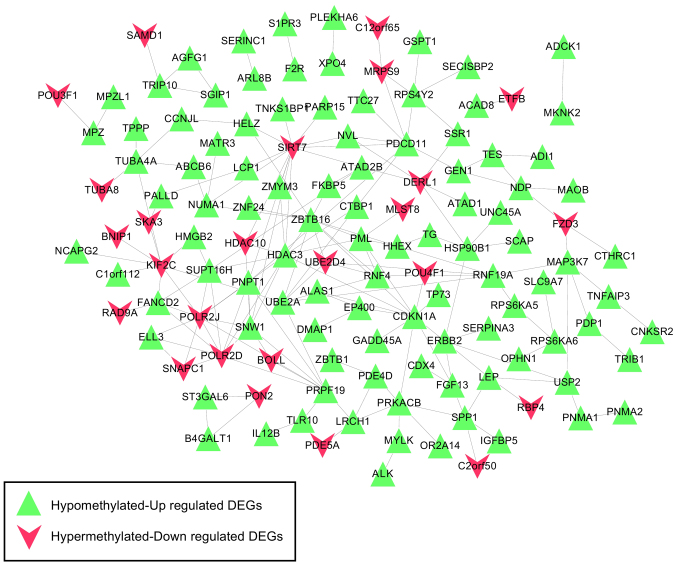
Figure 4.
Constructed protein-protein interaction network based on the interactions involving genes with negative correlation between expression levels and methylation levels. As illustrated by the key, the green triangles represent the hypomethylated, upregulated DEGs, whereas the red symbols denote the hypermethylated, downregulated DEGs. DEG, differentially expressed gene.

