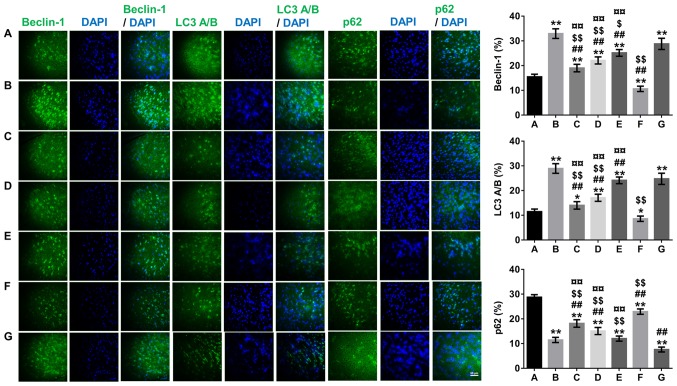
Figure 4.
Effects of β-asarone on autophagy-related protein expression (Beclin-1, LC3 and p62) in the hippocampus of Alzheimer's disease model mice by immunofluorescence staining analyses. The samples detected were tissues rather than cells and most of the expressions were normal. Images were captured with an Olympus fluorescence microscope (not taken by confocal microscopy due to experimental conditions) so the images presented are not punctate; magnification, ×400. A, Normal group; B, model group; C, low-dose β-asarone group; D, medium-dose β-asarone group; E, high-dose β-asarone group; F, 3-MA-treated group; and G, the rapamycin-treated group. Data are presented as the mean ± SD of 10 mice. *P<0.05 and **P<0.01 vs. normal group; ##P<0.01 vs. model group; $P<0.05 and $$P<0.01 vs. rapamycin-treated group; ¤¤P<0.01 vs. 3-MA-treated group. 3-MA, 3-methyladenine; LC3, light chain 3.

