
Figure 6.
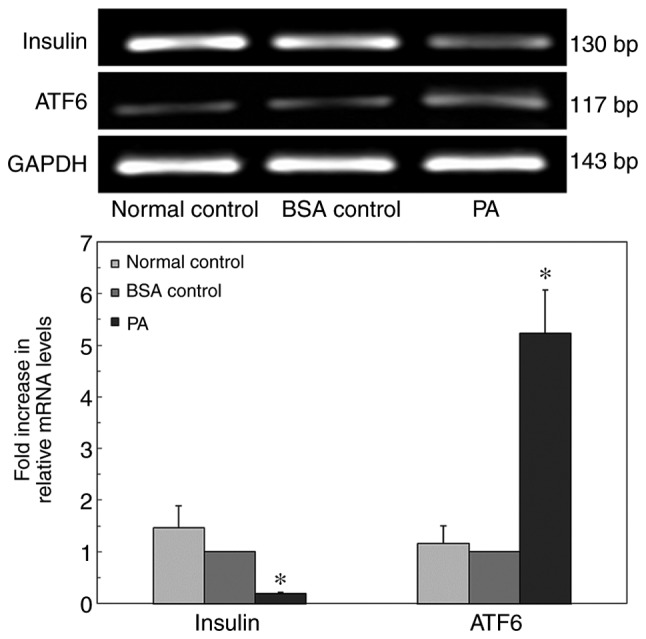
Quantitative PCR analysis of ATF6 and insulin mRNA expression in INS-1 cells cultured in a high-lipid environment. *P<0.05 vs. normal control group and BSA control group. ATF6, activating transcription factor 6; PA, palmitate.
Official websites use .gov
A
.gov website belongs to an official
government organization in the United States.
Secure .gov websites use HTTPS
A lock (
) or https:// means you've safely
connected to the .gov website. Share sensitive
information only on official, secure websites.
Quantitative PCR analysis of ATF6 and insulin mRNA expression in INS-1 cells cultured in a high-lipid environment. *P<0.05 vs. normal control group and BSA control group. ATF6, activating transcription factor 6; PA, palmitate.