Figure 1.
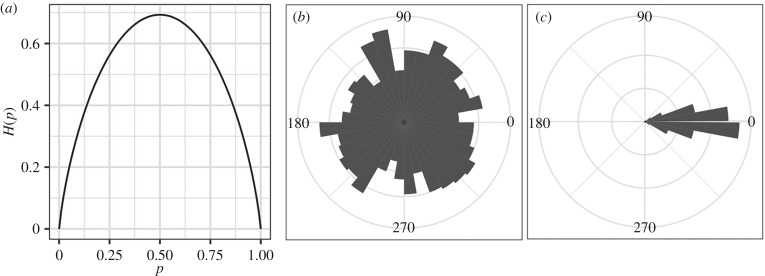
Shannon entropy. (a) The Shannon entropy in nats for the simplest case of only two possible outcomes, p and 1 − p [33]. (b,c) Illustration of how the Shannon entropy of a standard movement variable, individual orientation, can vary with ecological context. A group of animals can show greater variability in their orientations as they forage semi-independently of one another in an area (b), but this variability can drop as they travel together towards a common goal (c). On average, the change in variability between (b) and (c) corresponds to a drop in Shannon entropy, in nats, from (b) H(X) = 2.04 ± 0.006 to (c) H(X) = 1.32 ± 0.03. Estimates of p(x) were calculated from 1000 random samples of X, drawn either from a uniform distribution bounded by [0, 2π] or a Gaussian one (mean = 0, sd = 0.25) modulo 2π. Values of x were then sine transformed and binned to estimate p(x). Bin widths were defined by the optimal width determined in the uniform distribution using the Freedman–Diaconis algorithm [52]. We then replicated this process 1000 times to estimate the mean and standard deviation of H(X) for each distribution.

