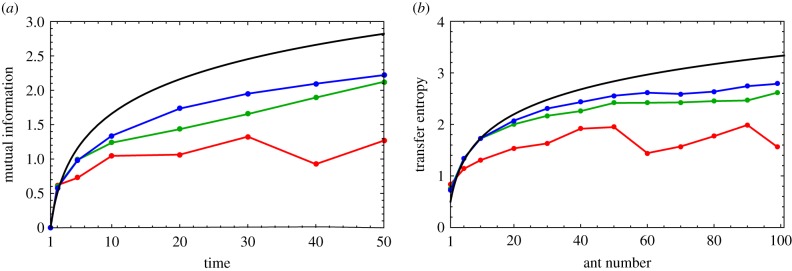
Figure 10.
IT metrics: theory versus simulation. (a) The mutual information MI(Xn(t); Xn(t − 1)) plotted as a function of time. This quantity is independent of n for t < n, allowing for data points for multiple agents at the same time to be compiled. The black curve is the analytic result, and the red, green and blue curves correspond to datasets of 50, 450 and 950 data points, respectively. (b) The long-time transfer entropy plotted as a function of the ant number n. The black curve is again the analytic result, and the coloured curves represent datasets of the same sizes as in (a), except that in this case they are compiled over time points for fixed n since the TE is constant for times t > n.

