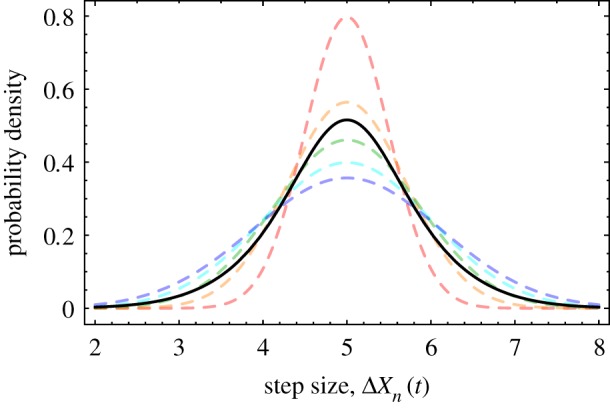
Figure 11.

The effects of aggregating data across time points and agents. In the ant model, for a chain of five ants with a mean step size of five units, the step size ΔXn(t) can be shown to sample, for different values of t and n, from five different normal distributions, plotted as dashed curves. The black solid curve represents the mean of these distributions and is what one samples if the data for ΔXn(t) is aggregated across all values.
