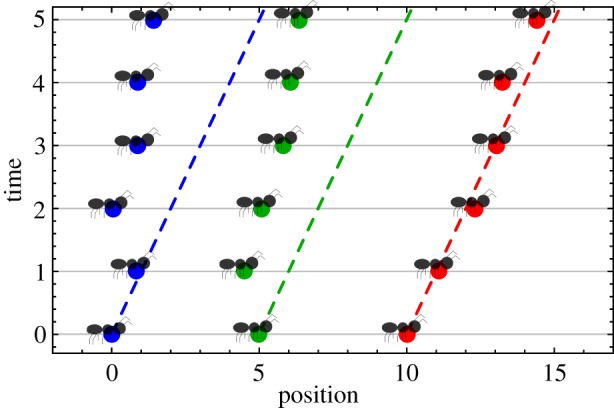
Figure 2.

Ant model trajectory. A sample trajectory of the ant model used as an example throughout this section. The position of each of the three ants is given on the abscissa, and each horizontal slice shows the configuration of the system at different times (both measured in arbitrary model units). Each dashed line shows what the trajectory of the like-coloured ant would be in the absence of any stochasticity. Note how the middle ant (green) initially takes a step backwards, which results in its follower (blue) making a backwards move one time step later.
