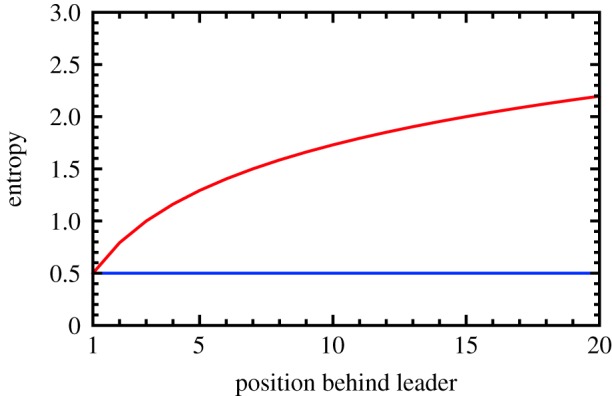
Figure 5.

Comparison of transfer and causation entropy. The long-time limiting value of the transfer entropy and the t > 1 value of the causation entropy are plotted in red and blue, respectively, for the ant model as a function of the position behind the leader (n > 0) in units of bits. The constant CSE for each pair of adjacent ants is a reflection of the homogeneity of the model’s rule-based interactions. Any differences in the dynamics of each ant derive from the indirect influence of the ants further up front, which is reflected in the growth of the TE curve as that number increases. The logarithmic character of this growth suggests that the efficiency of indirect influence falls off with distance.
