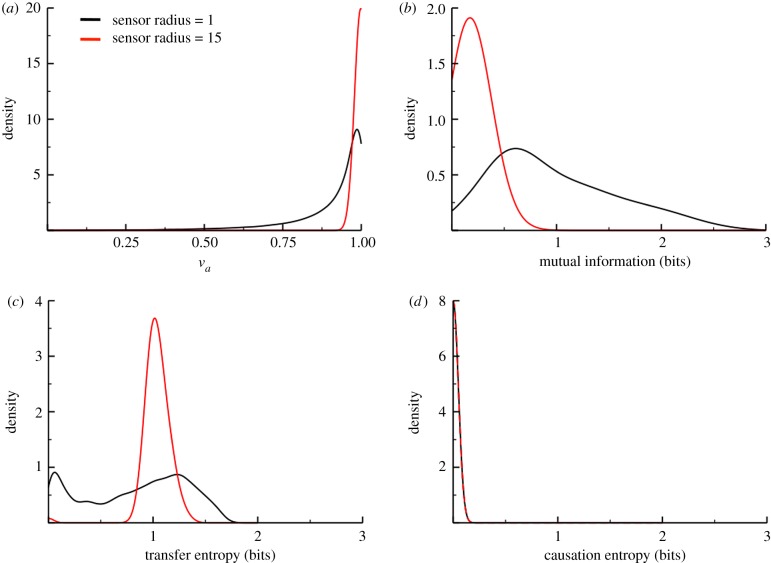
Figure 8.
Probability distributions for each sensory scenario. Panels show the distribution of values for the order parameter (a), the mutual information (b), the transfer entropy (c) and the causation entropy (d). Curves are coloured by scenario (local interactions, black; global interactions, red). Data were collected from 100 replicate simulations, each of which was allowed to first reach a steady state. For each replicate, IT metrics were computed for each pair of agents, and the results were compiled into the plotted distributions. The Freedman–Diaconis rule [52] was used to histogram all the datasets. Simulation parameters: N = 50, L = 10, Δt = 1,vo = 0.1, R = 1, 15 and η = 10−3/2.

