
Figure 9.
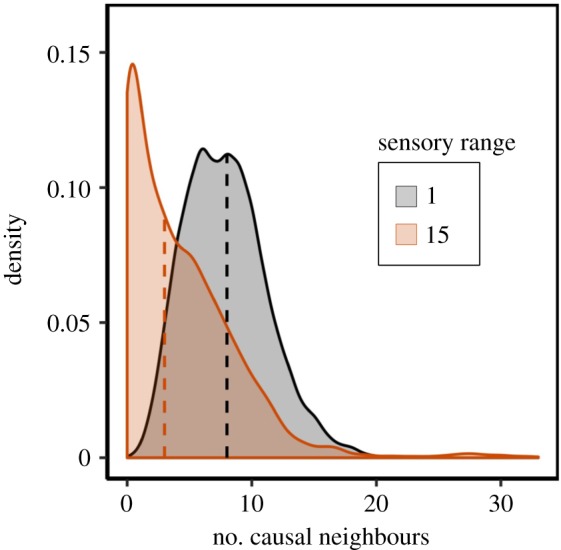
Distribution of causal neighbours. Influential neighbours were identified using the oCSE algorithm (see electronic supplementary material, S1). Dashed lines represent the median value of each distribution (4 and 8 for the global and local scenarios, respectively).