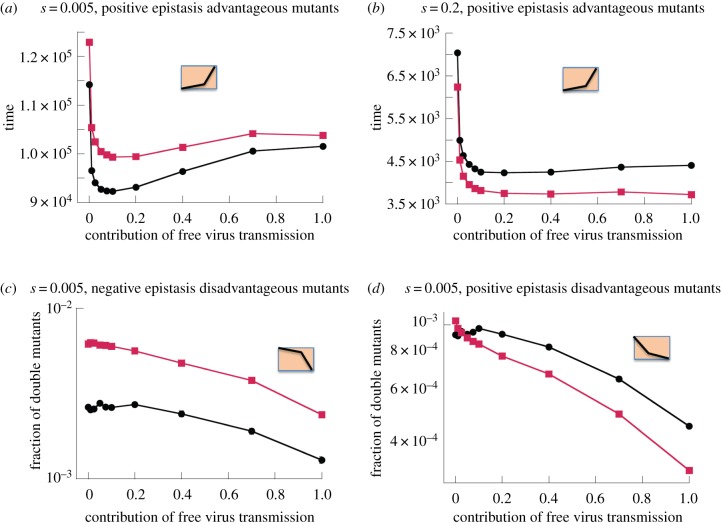
Figure 2.
The role of recombination in (a,b) advantageous and (c,d) disadvantageous mutant dynamics; fitness landscapes are shown schematically in the insets. Red: with recombinations, and black: without recombination. (a,b) The time until the advantageous mutant reaches 90%, as a function of the fraction of free virus transmission. The means and standard errors are shown. For equivalent plots with standard deviations, see electronic supplementary material, §5.3. (a) s = 0.005, α = 0.75, (b) s = 0.2, α = 0.75. (c,d) The fraction of disadvantageous mutants at time T = 105, as a function of the fraction of free virus transmission. The means and standard errors are shown. (c) s = 0.005, α = 0.25 (d) s = 0.005, α = 0.75. The parameters are: β + γ = 0.1, S = 3, λ = 1, d = 0.01, a = 0.02, , μ = 3 × 10⁻⁵. All averages are based on at least 104 simulations.

