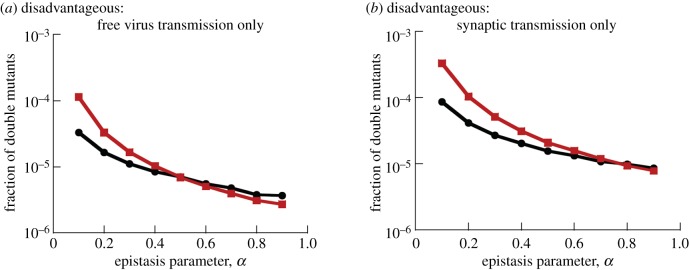
Figure 4.
The role of recombinations under different transmission modes, for disadvantageous mutants. Shown is the temporal average of the fraction of double mutants at selection–mutation balance, as a function of that parameter α, defining the nature and extent of epistasis. Red denotes simulations with recombination and black without recombinations. (a) Free virus transmission only, (b) synaptic transmission only. s = 0.05, and other parameters are as in figure 2. Standard errors are too small to see. For equivalent plots with standard deviations, see electronic supplementary materials, §5.3.

