
Fig 1.
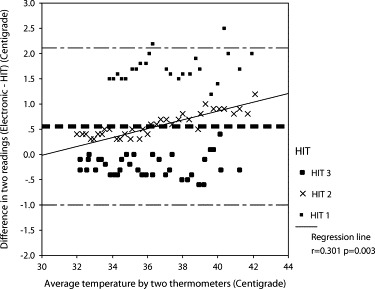
Difference against average of readings from HIT and electronic thermometer, with 95% limit of agreement (thin broken lines), mean difference (thick broken line), and regression line (solid line).
Official websites use .gov
A
.gov website belongs to an official
government organization in the United States.
Secure .gov websites use HTTPS
A lock (
) or https:// means you've safely
connected to the .gov website. Share sensitive
information only on official, secure websites.
Difference against average of readings from HIT and electronic thermometer, with 95% limit of agreement (thin broken lines), mean difference (thick broken line), and regression line (solid line).