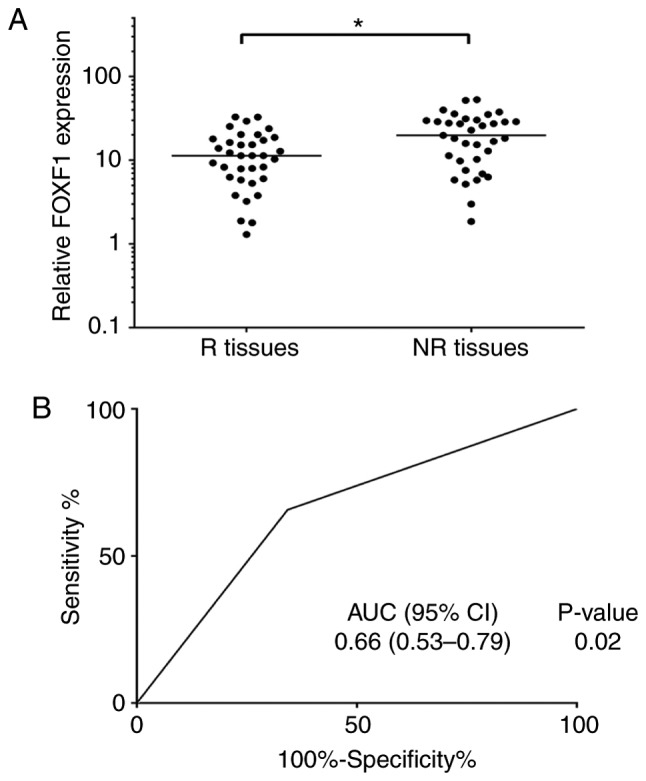
Figure 3.

Expression levels of FOXF1 are associated with platinum-based chemotherapy response. (A) Scatter plots of expression of FOXF1 in responders and non-responders. Relative FOXF1 expression represents the ratio of FOXF1 expression in cancer tissue to FOXF1 expression in adjacent tissue [R, responder (response or partial response); NR, non-responder (stable or progressive disease)]. (B) ROC analyses assessing the association of FOXF1 expression level and platinum-based chemotherapy response (NR or R), where FOXF1 expression level was dichotomized and its categories represented by the score of 0 or 1 as follows: Score 1 (high risk) = FOXF1 level ≥ median; score 0 (low risk) = FOXF1 level < median. FOXF1, forkhead box F1.
