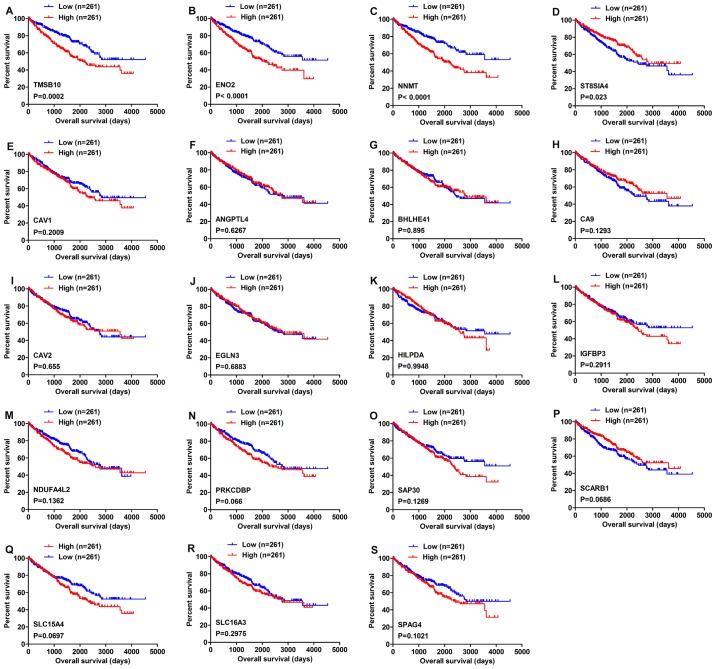
Figure 2.
Overall survival analysis of 19 commonly upregulated genes conducted using the OncoLnc database. (A) TMSB10, (B) ENO2, (C) NNMT, (D) ST8SIA4, (E) CAV1, (F) ANGPTL4, (G) BHLHE41, (H) CA9, (I) CAV2, (J) EGLN3, (K) HILPDA, (L) IGFBP3, (M) NDUFA4L2, (N) PRKCDBP, (O) SAP30, (P) SCARB1, (Q) SLC15A4, (R) SLC16A3 and (S) SPAG4. P<0.05 was regarded as statistically significant by log-rank test. Blue lines indicate low gene expression, while red lines represent high gene expression.

