
Fig. 1.
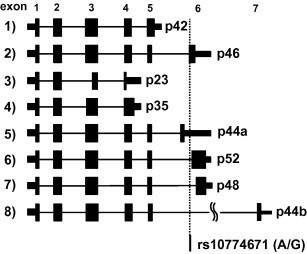
Schematic representation of OAS1 transcript variants. Alternatively spliced exons, the predicted protein size, and the position of the SNP at the splice acceptor site (rs10774671) are shown. The number in parenthesis indicates each transcript, corresponding to that in Table 1. Coding regions are indicated by wide rectangles, noncoding regions by narrow rectangles, and introns by lines. We designated the isoform with an alternate exon in intron 5 as p44a, and that with exon7 as p44b.