
Fig. 3.
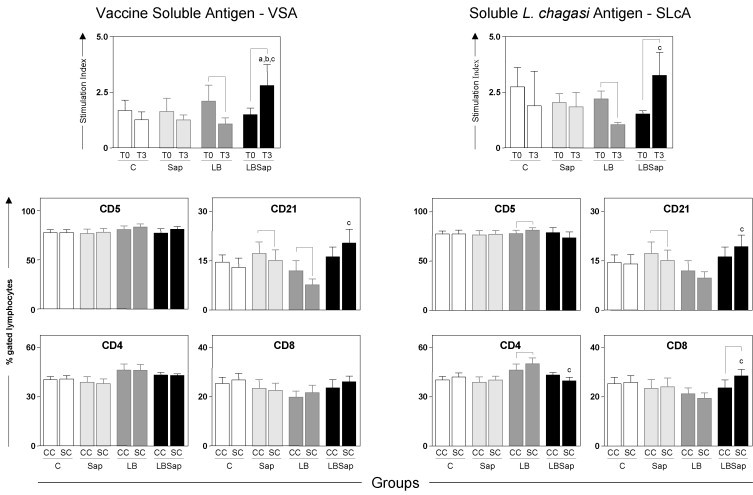
Cell proliferation response of peripheral blood mononuclear cells after stimulation with vaccine soluble antigen (VSA) (upper left panel) and soluble L. chagasi antigen (SLcA) (upper right panel). The middle and lower panels show the immunophenotypic profile of in vitro peripheral blood mononuclear cells following stimulation with vaccine soluble antigen (VSA) (left panels) and soluble L. chagasi antigen stimulation (right panel) determined at T3 for treatment groups: C (control; □); Sap (saponin;  ); LB (killed L. braziliensis vaccine;
  ); LBSap (killed L. braziliensis vaccine plus saponin; ■). The results are expressed as the mean frequencies of CD5+, CD21+, CD4+ and CD8+ cells in the non-stimulated cultures (CC; controls) and in the stimulated cultures (SC). Significant differences (P < 0.05) between values measured at T0 (before the first dose) and T3 (15 days after the third dose) are indicated by connecting lines, and between the LBSap and the control C, Sap, and LB groups at T3 are represented by the letters a, b, and c, respectively.