
Fig. 3.
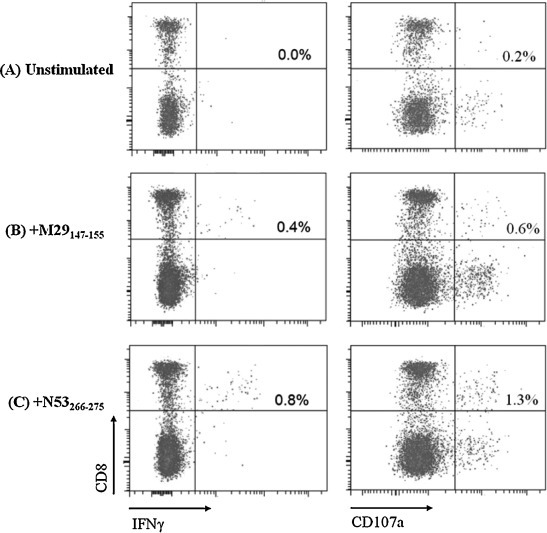
ICS and flow cytometry analysis of restimulated T cells from SARS subject 1 at 11 years post-infection. Percentages of CD8+IFNγ+ responses (left panels) and CD8+CD107a+ responses (right panels) of (A) unstimulated, (B) M29147–155-stimulated, (C) N53266–275-stimulated T cells are as indicated in the upper right quadrant of each dot plot. Percentage CD8+ IFNγ+ cells shown represent the percentage of IFNγ-producing cells in the total T cell population (after gating the CD3+ cells) which were in vitro expanded in the presence of M29147–155 and N53266–275 peptides.