Table 2.
The growth-inhibition effects in vitro of 1,2,3-triazolyl 4,5-unsaturated l-ascorbic acid derivatives (10c−10p) on selected tumor cell lines and normal fibroblasts.
| Compd. | R | IC50a/μM |
cLogPb | |||||||
|---|---|---|---|---|---|---|---|---|---|---|
| A549 | CFPAC-1 | HCT-116 | HeLa | HepG2 | MCF-7 | SW620 | HFF | |||
| 10c | 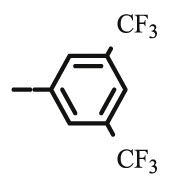 |
>100 | >100 | >100 | >100 | >100 | >100 | >100 | >100 | 5.36 |
| 10d |  |
>100 | NA | >100 | 17.69± 58.20 |
>100 | >100 | >100 | >100 | 3.86 |
| 10e | 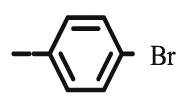 |
>100 | >100 | >100 | 24.31± 53.52 |
>100 | >100 | >100 | >100 | 4.39 |
| 10f | 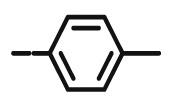 |
>100 | >100 | >100 | 7.48± 70.70 |
>100 | >100 | >100 | >100 | 4.0 |
| 10g |  |
>100 | >100 | >100 | >100 | >100 | 39.14± 70.11 |
>100 | >100 | 3.59 |
| 10h | 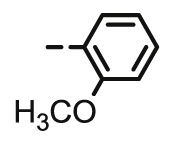 |
>100 | >100 | >100 | >100 | >100 | >100 | >100 | >100 | 3.59 |
| 10i | 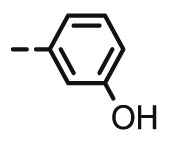 |
23.3± 0.26 |
33.69± 0.43 |
63.58± 0.41 |
74.80± 0.40 |
61.68± 0.65 |
27.77± 0.35 |
69.79± 1.66 |
42.57± 0.16 |
3.32 |
| 10j |  |
>100 | >100 | >100 | >100 | >100 | >100 | >100 | >100 | 5.78 |
| 10k | 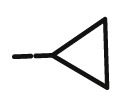 |
>100 | 97.11± 0.37 |
32.43± 0.96 |
76.75± 0.30 |
53.12± 0.69 |
9.27± 0.25 |
29.49± 1.24 |
17.03± 0.49 |
3.08 |
| 10l | >100 | 72.49± 0.35 |
61.19± 0.53 |
67.70± 0.37 |
77.07± 0.56 |
57.24± 0.80 |
49.45± 1.04 |
49.51± 0.38 |
3.63 | |
| 10m |  |
>100 | >100 | 98.83± 0.31 |
>100 | >100 | 72.02± 0.35 |
91.69± 0.42 |
>100 | 6.36 |
| 10n |  |
5.25± 0.13 |
>100 | 47.29± 0.54 |
>100 | 62.19± 0.60 |
4.93± 0.17 |
20.67± 0.58 |
49.85± 0.23 |
3.55 |
| 10o | 96.52± 0.17 |
>100 | 66.84± 0.56 |
66.84± 0.25 |
81.12± 0.49 |
23.55± 0.42 |
21.61± 0.53 |
94.07± 0.13 |
3.41 | |
| 10p |  |
>100 | 43.38± 0.51 |
27.90± 0.89 |
27.90± 1.10 |
39.03± 1.0 |
37.18± 1.24 |
41.91± 1.3 |
25.61± 0.80 |
1.80 |
| L-ASA | >100 | >100 | >100 | >100 | >100 | >100 | >100 | >100 | −2.47 | |
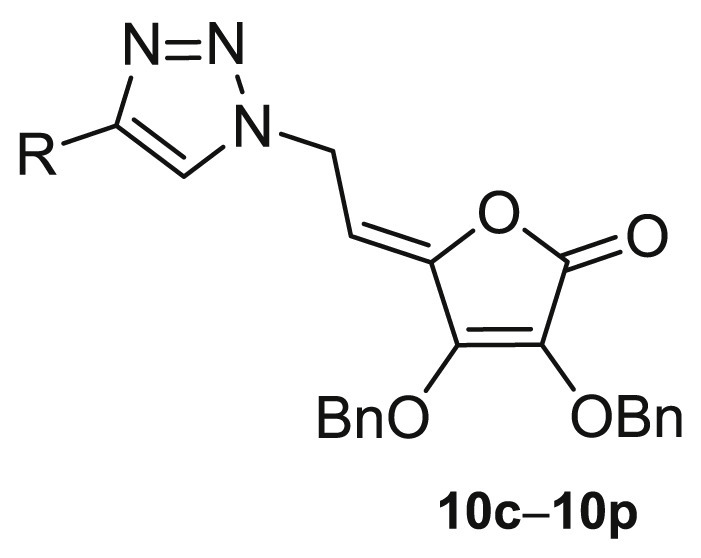
50% inhibitory concentration or compound concentration required to inhibit tumor cell proliferation by 50%. NA = not active.
Values of n-octanol/water partition coefficients clog P were calculated by DataWarrior [36].
