Figure 3.

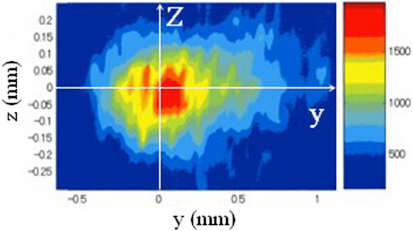
Spatial distribution (3D plots) of the optical emission intensity of atomic hydrogen H I (656.3 nm) observed around the needle electrode. The origin is the point of the electrode corresponding to the peak position of the intensity.

Spatial distribution (3D plots) of the optical emission intensity of atomic hydrogen H I (656.3 nm) observed around the needle electrode. The origin is the point of the electrode corresponding to the peak position of the intensity.