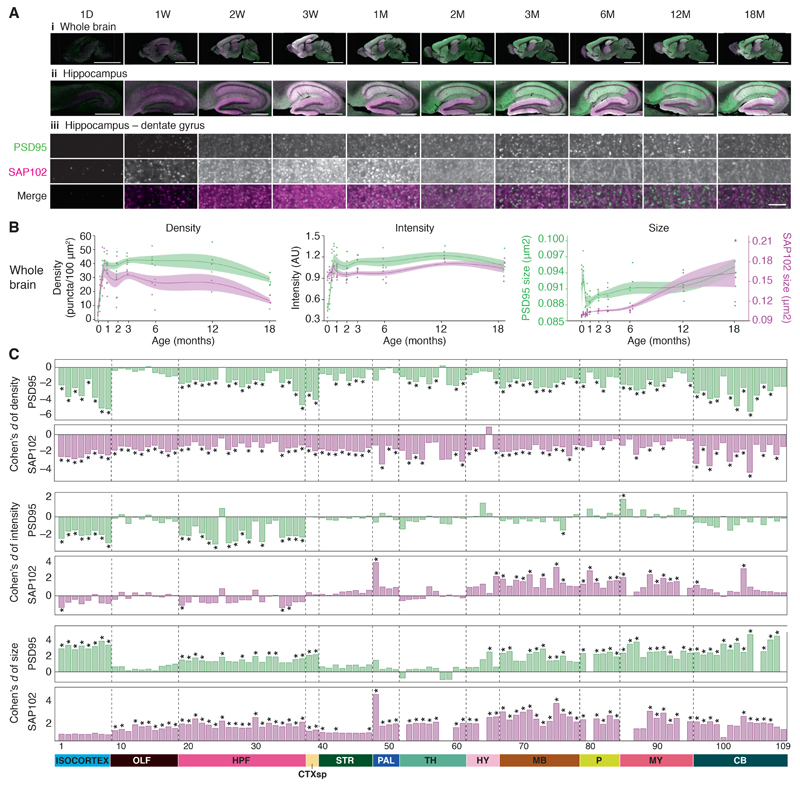
Figure 1. Lifespan trajectories of synapse parameters.
A. PSD95-eGFP (green) and SAP102-mKO2 (magenta) expression acquired at low (20X, i and ii) and high (100X, iii) magnification in the whole brain (i), hippocampus (ii), and molecular layer of the dentate gyrus (iii) at ten ages across the mouse postnatal lifespan. Scale bars: i, 4 mm; ii, 500 μm; iii, 3.5 μm. D, day; W, week; M, month.
B. Lifespan trajectories of synapse density, intensity (normalized to the mean intensity, arbitrary units: AU) and size in the whole brain. PSD95-eGFP (green) and SAP102-mKO2 (magenta). Points represent individual mice, with beta-spline smoothed curve of mean values and standard error of the mean.
C. Differences (Cohen’s d) in synapse parameters between 3M and 18M in brain subregions (numbered, see Table S1). *P < 0.05, Bayesian test with Benjamini-Hochberg correction. CB: cerebellum, CTXsp: cortical subplate, HPF: hippocampal formation, HY: hypothalamus, MB: midbrain, MY: medulla, OLF: olfactory areas, P: pons, PAL: pallidum, STR: striatum, TH: thalamus.

