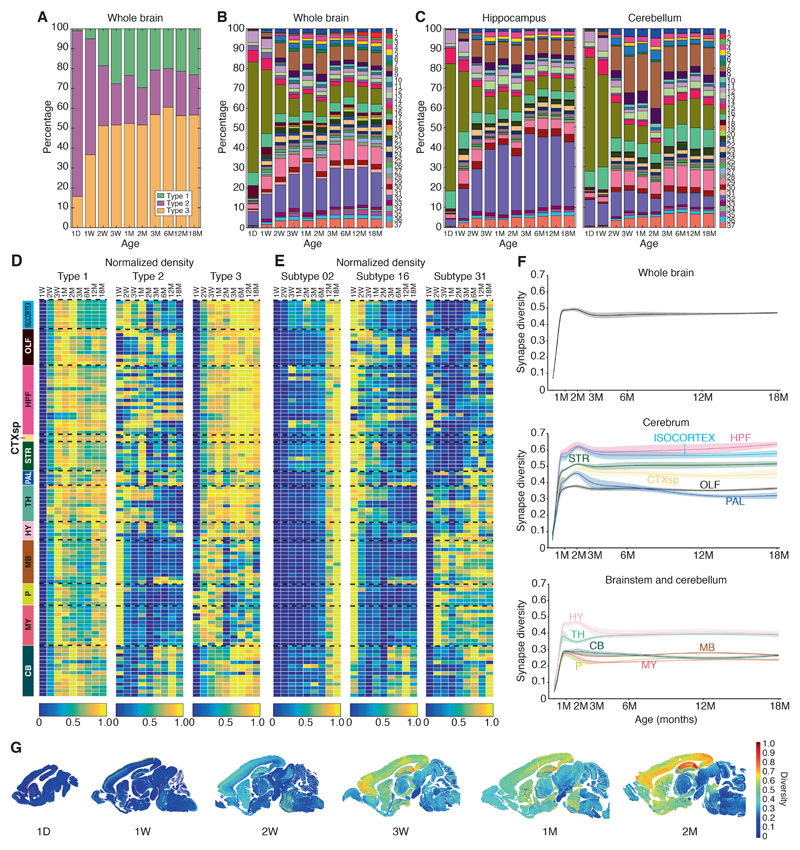
Figure 2. Lifespan trajectories of synapse types, subtypes and diversity.
A. Stacked bar plot of percentage of synapse type density (type 1, PSD95 only; type 2, SAP102 only; type 3, colocalized PSD95+SAP102) in the whole brain across the lifespan.
B. Percentage of synapse subtype density in the whole brain across the lifespan. Key: synapse subtypes (1–37).
C. Percentage of synapse subtype density in hippocampus and cerebellum across the lifespan.
D. Lifespan trajectories of synapse type (normalized) density in 12 regions and 109 subregions (rows, see Table S1). Density in each subregion was normalized (0-1) to its maximal density across the lifespan (columns). Twelve brain regions are shown (abbreviations as Fig. 1C).
E. Lifespan trajectories of three representative synapse subtypes (2, 16, 31) in each of 109 subregions (rows) (see Table S1). Density in each subregion was normalized (0-1) to its maximal density across the lifespan (columns).
F. Lifespan trajectories of synapse diversity (Shannon entropy) for whole brain (top) and main regions from the cerebrum (middle) and brainstem and cerebellum (bottom). Beta-spline smoothed curve of mean and standard error of the mean are shown.
G. Unsupervised synaptome maps showing the spatial patterning of synapse diversity (Shannon entropy) per area (pixel size 21.5 μm x 21.5 μm) in representative para-sagittal sections (all ages available in Fig. S15 and website(8)).

