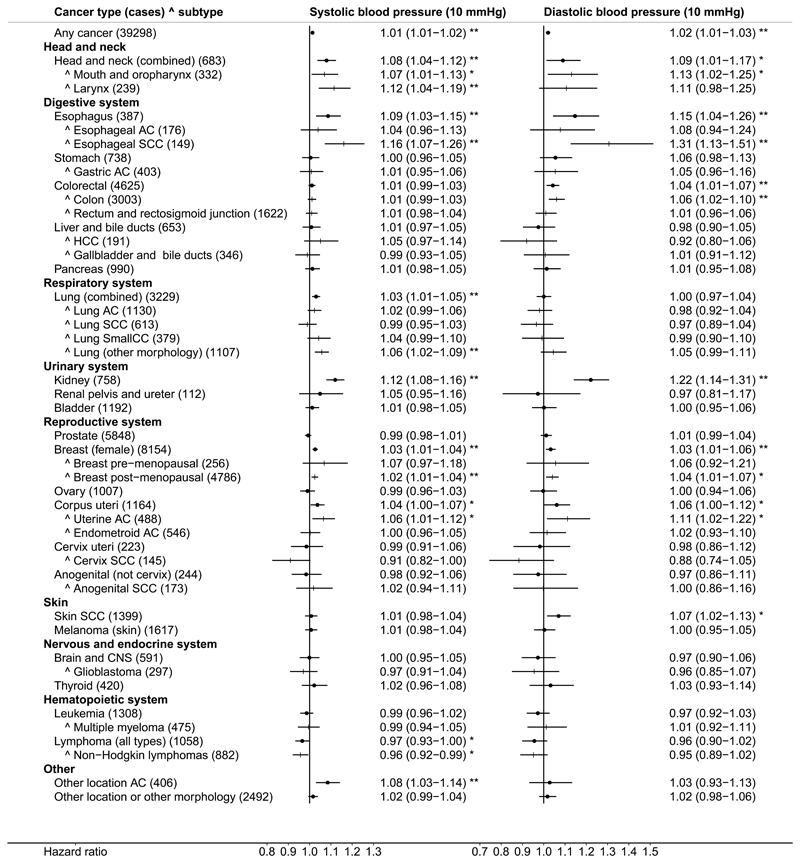
Figure 2. Forest plot of hazard ratios for continuous systolic and diastolic blood pressure.
AC – adenocarcinoma; CNS – central nervous system; HCC – hepatocellular carcinoma; SCC – squamous cell carcinoma; SmallCC – small cell carcinoma; Vertical order – determined by the hazard ratio estimates for systolic blood pressure (SBP) of the main anatomical locations (dot symbols), each followed by the relevant specific locations or morphologies marked with ^ (+ symbols) (other locations, not included in those specified, are shown last); Hazard ratios – estimates (95% confidence intervals) (per 10mmHg higher blood pressure) derived from Cox proportional hazards models, stratified by study centre and age at recruitment (5-year categories) and adjusted for potential confounders and risk factors listed in Supplementary Table 2). For cervical AC (n=37): HR=0.96 (0.79-1.17) for SBP and HR=0.84 (0.59-1.19) for DBP and for other morphology in the cervix (non-SCC and non-AC) (n=41): HR=1.28 (1.10-1.48) for SBP and HR=1.53 (1.17-2.01) for DBP (considered only in the main analyses and excluded to avoid the larger confidence intervals dominating the plot); * p<0.05, ** p<0.005.

