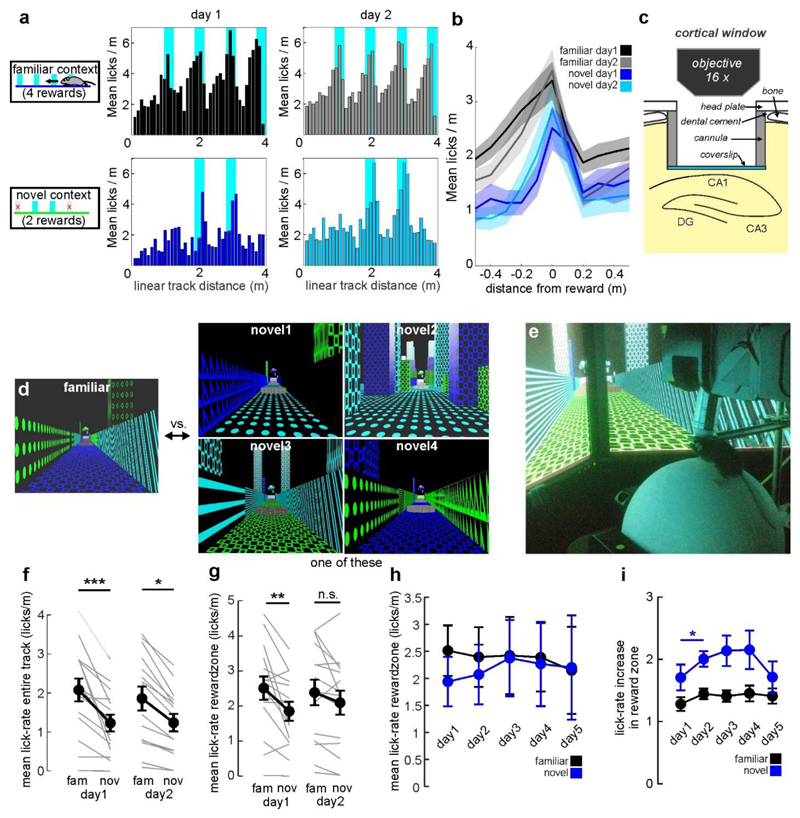
Extended Data Figure 1. Virtual environment behavioural paradigm for head-fixed mice (related to Fig. 1).
(a) Left, schematic illustration of the virtual linear tracks (side view). Four of the reward locations were offered in the familiar context, but only two in the novel one. Right, Mean number of licks per spatial bin (10 cm wide) for one example mouse on day 1 (left) and day 2 (right) on the familiar (top, grey) and novel (bottom, blue) linear track. (b) Mean lick rate per bin as a function of distance from the next reward location for the familiar (black traces) and novel context (blue traces). Shaded areas denote SEM. (c) Schematic of the transcortical window implantation. A stainless steel cannula (3 mm diameter) with a circular coverslip attached to its bottom is implanted into the brain and resting on the external capsule on top of the hippocampus (Methods) (d) Screenshots of the familiar and the four different novel context sceneries. One novel context was randomly selected for each experiment from this set and maintained through all days. Note: If more than one experiment was performed in a given animal, a different novel context was chosen for each of the experiments. (e) Photograph of the mouse in the virtual environment setup. Depicted is an animal in the CA2/3 recording group with tilted objective for lateral access view (Methods) (f) Mean lick rate over the entire familiar (left) or novel (right) track on day 1 (left group) or day 2 (right group). Grey lines denote individual experiments and black circles with error bars the mean. (g) Same as in (d) but for mean lick rate in the reward zones only. (h) Reward related licking plotted for the experiments continued over 5 days. In this subset of the data (n=5 experiments) no significant differences in licking between contexts was observed on any day (ANOVA), although there was a trend for lower lick rates on the novel context. (i) Lick rate increase in the reward zone (as compared to licking on the remaining track). An increase in the fraction of reward-related licks was observed only between day 1 and 2. (* p<0.05; one way ANOVA). (d,e) ** p<0.01, *** p<0.001, n.s. not significant; paired t-test between contexts. Error bars denote SEM.

