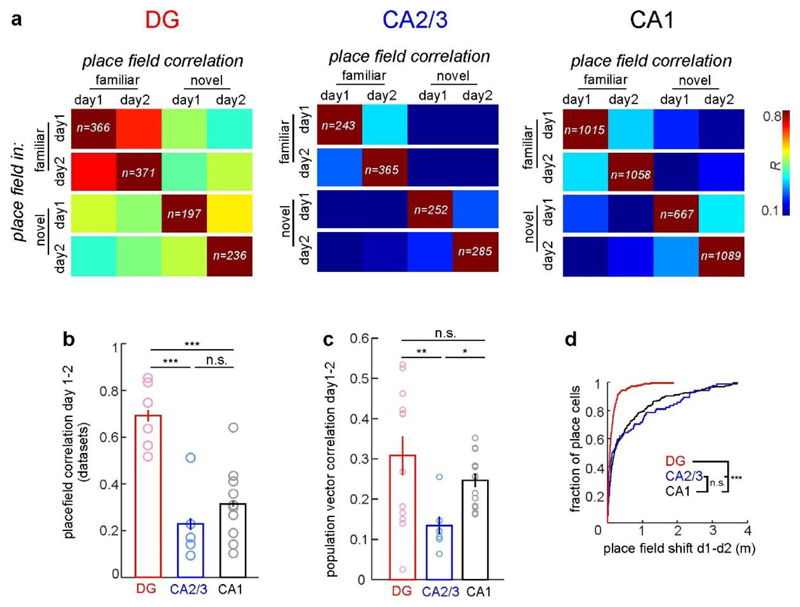
Extended Data Figure 3. Place field remapping between days.
(a) Mean cellular activity map correlations over two days and contexts as indicated on the x-axis. Each row shows mean correlation values for cells (n is shown as white number) that had a place field on the day and track indicated on the y-axis. (b) For all cells that had a place field in the familiar context on either day, the activity map correlations for the familiar context was determined between days and averaged for all experiment with at least 20 place cells (light circles). The means of these per-experiment measures were compared statistically (bars). * p<0.05, *** p<0.001; one-way ANOVA with Holm-Sidak test. (c) Population vector correlations between days were determined for each context and averaged between the novel and familiar context for each experiment. Population vector stability between days was high in GCs, intermediate for CA1 PYR and low for CA2/3 PYR. * p<0.05, ** p<0.01, n.s. not significant; one-way ANOVA on Ranks with Dunn’s test. (d) For all cells that had a place field in the familiar context on both days of the experiment, the centres of mass for the activity in these place fields was determined. The graph shows the cumulative distribution of the distances between these centres (shift) between day 1 and 2, which gives a measure for the relocation of place fields between days. *** p<0.001, n.s. not significant; one-way ANOVA on Ranks with Dunn’s test.

