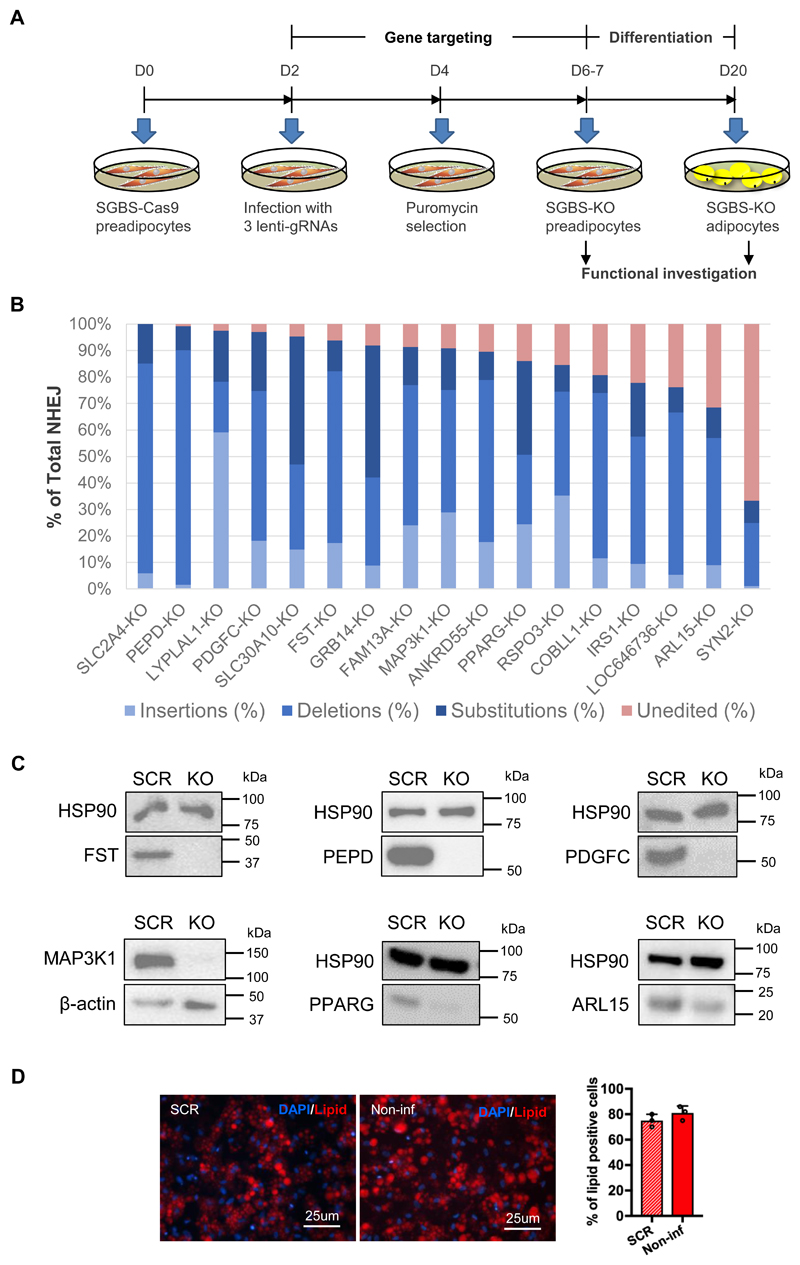
Figure 1. Examination of gene knockout efficiency at the genomic level in SGBS-preadipocytes.
(A) Experimental schedule of CRISPR/Cas9 targeting, differentiation and functional investigation of SGBS cells. (B) Knockout efficiency quantified by next generation sequencing (NGS) of the target sites. In the bar graph, the strata of blue bars indicate the total percentage of the three types of non-homologous end joining (NHEJ) including insertions, deletions and substitutions. The red bar on the top shows the percentage of unedited sequence. The size distribution of NHEJ in each KO-line is presented in Online Figure II. Total sequence reads per sample =150,000 – 300,000. (C) Confirmation of gene knockout at the protein level by Western Blot in the FST-, PEPD-, PDGFC-, MAP3K1-, PPARG- and ARL15-KO cell lines, as indicated. (D) Differentiation efficiency of the scrambled (SCR)- and non-infected (non-inf) - SGBS-Cas9 preadipocytes. Representative images of SGBS-adipocytes stained with lipid dye (red) and DAPI (blue) are shown. The bar graph displays the percentage of lipid positive cells in the staining images of adipocytes derived from the two cell lines, mean ± SD, n=3.

