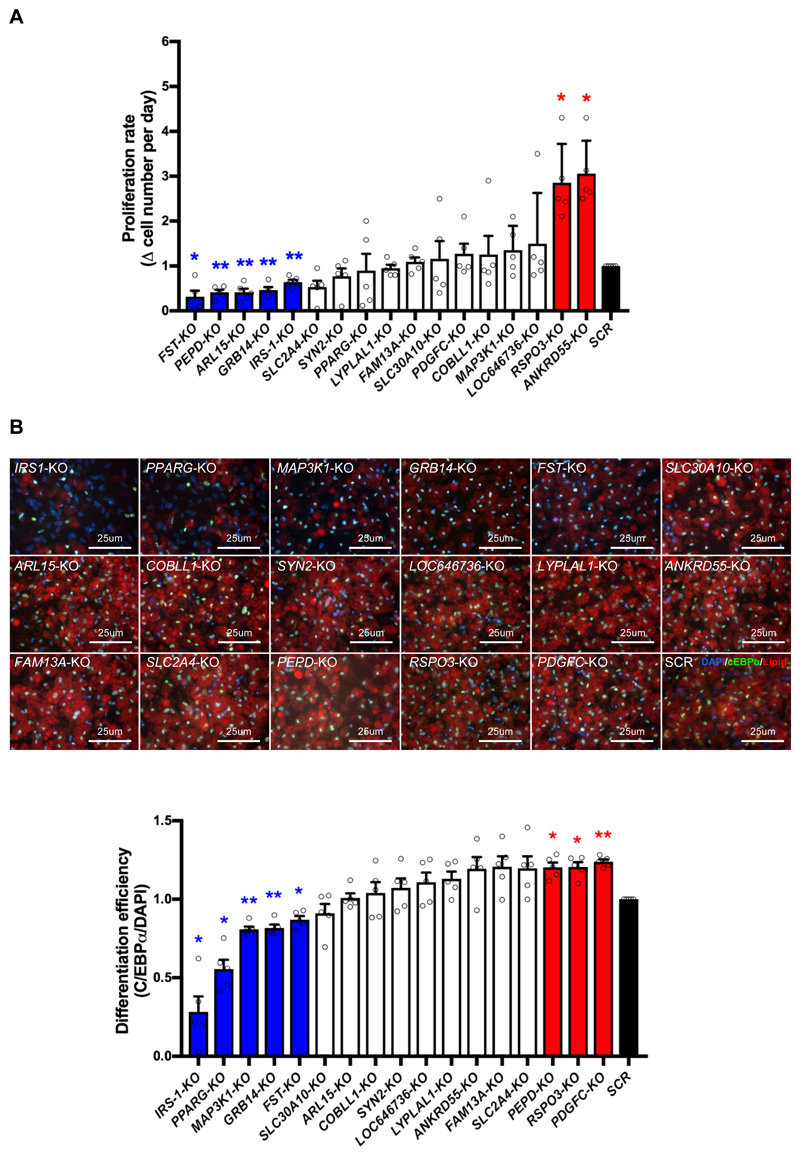
Figure 2. KO of IR-genes affects adipogenesis of preadipocytes.
(A) Proliferation rate of each SGBS-KO preadipocyte line was calculated by increase (Δ) in cell number per day, and the results are presented as a bar graph. Bars in blue and red indicate KO-lines with decreased and increased proliferation rate respectively, in comparison to the SCR control (in black). The white bars show data without significant difference from the SCR control. (B) Visualization of IR gene effect on SGBS preadipocyte differentiation. The upper panel shows pseudo-colored images of gene KO-adipocytes stained for C/EBPα (Green), DAPI (Blue) and lipid droplets (red). The lower panel displays differentiation efficiency of each KO-SGBS preadipocyte line calculated as the percentage of C/EBPα-expressing cells among the DAPI positive cells. Bars in blue and red indicate SGBS-KO cell lines with decreased and increased differentiation efficiency respectively, in comparison to the SCR control (in black). The white bars show data without significant difference from the SCR control. All data are presented as mean ± SD, n=5 (*, p < 0.05; **, p < 0.01, FDR-adjusted).

