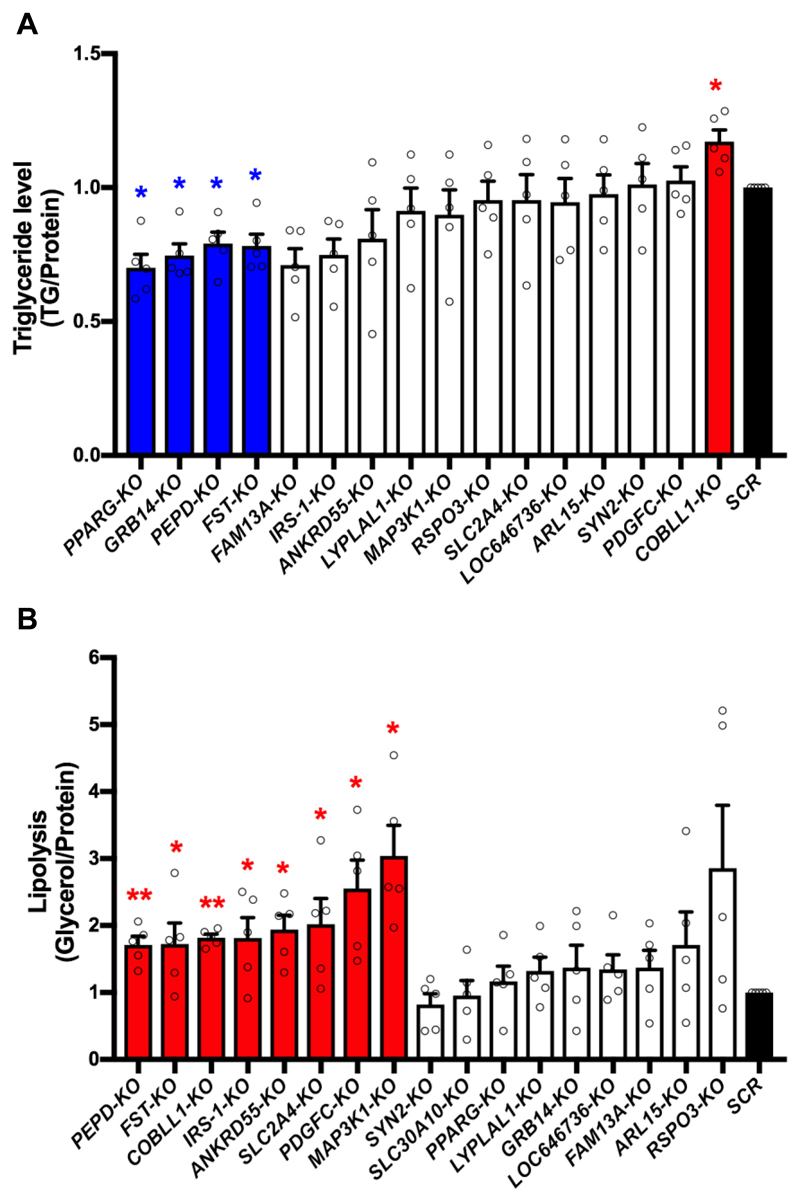
Figure 3. KO of IR-genes affects lipid metabolism of adipocytes.
(A) Triglyceride (TG) level of each SGBS-KO cell line was normalized to total protein. Bars in blue and red indicate KO-lines with decreased and increased TG/protein levels respectively, in comparison to the SCR control (in black). The white bars show data without significant difference from the SCR control. (B) Lipolysis of SGBS-KO adipocytes was calculated by normalizing free glycerol to total protein. Bars in red indicate SGBS-KO cell lines with increased lipolysis, in comparison to the SCR control (in black). The white bars show data without significant difference from the SCR control. All data are presented as mean ± SD, n=5 (*, p < 0.05; **, p < 0.01, FDR-adjusted).

