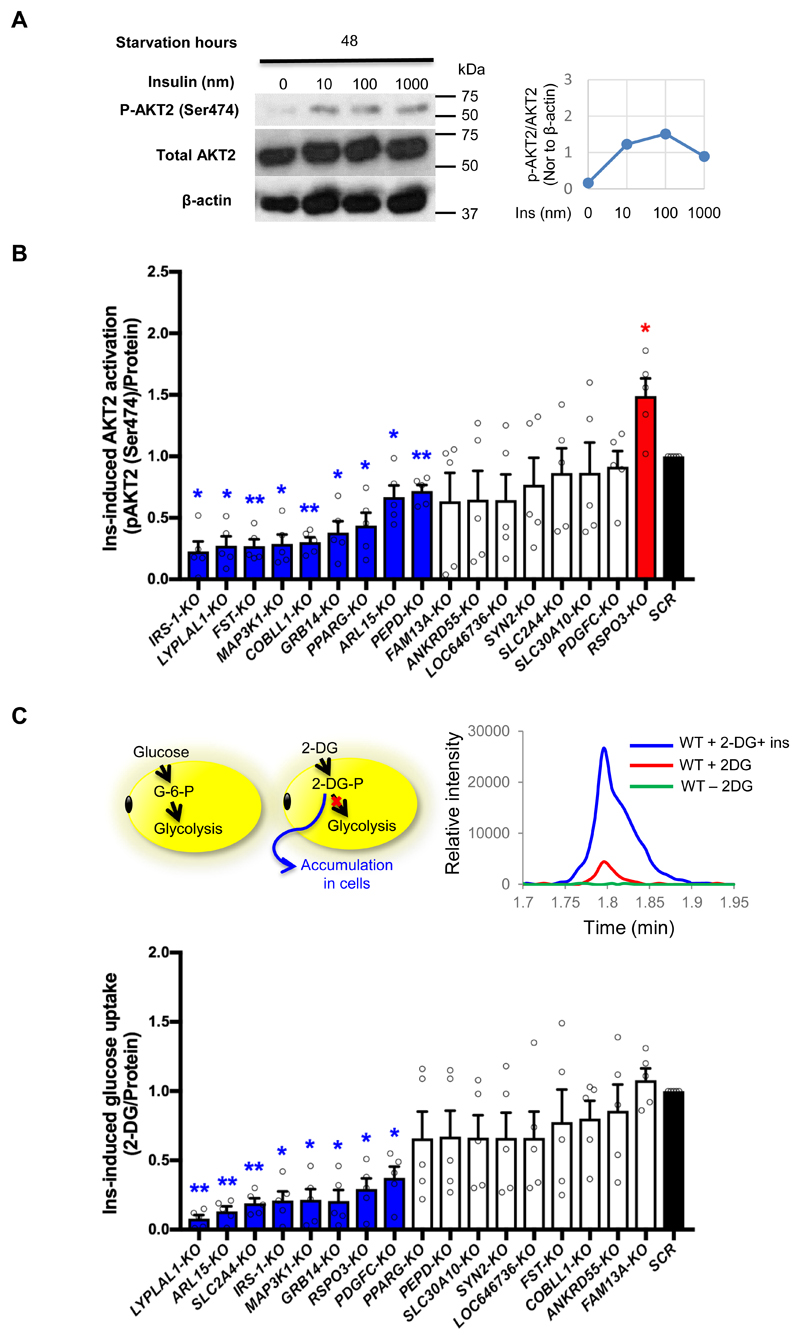
Figure 4. KO of IR-genes perturbs the insulin sensitivity of adipocytes.
(A) Insulin response of SGBS-adipocytes after 48 hours of starvation. We evaluated the levels of phosphor-AKT2 (Ser474), total AKT2 and β-actin of SGBS adipocyte after the treatment of 0, 10, 100 and 1000nm insulin (Ins). The line charts display the ratio of phospho-AKT2 (Ser474) to total AKT2 and the ratio was normalized to the β-actin level of the same sample. (B) Ins-induced phospho-AKT2 (Ser474) level of SGBS-KO adipocytes was calculated by change in p-AKT2 (Ser474) level induced by 10nm insulin after starvation, and the results were normalized to total protein amount and are presented as a bar graph. Bars in blue and red indicate KO-lines with decreased and increased p-AKT2 (Ser474) level respectively, in comparison to the SCR control (in black). The white bars show data without significant difference from the SCR control. (C) The cartoon in the upper left panel depicts uptake of the two analogs, D-glucose and 2-deoxy-D-glucose (2-DG) by adipocytes. The upper right panel shows the mass spectrogram for 2DG-6-P uptake by WT SGBS-adipocytes in three conditions, without treatment (green curve), with 2-DG only (red curve), and with 2-DG as well as 10 nM insulin (blue curve). The bottom panel displays insulin-induced glucose uptake of SGBS-KO adipocytes as 2-DG-6-P level after 30min of 10nm insulin treatment normalized to total protein amount. Bars in blue indicate KO-lines with decreased glucose uptake, in comparison to the SCR control (in black). The white bars show data without significant difference from the SCR control. All data are presented as mean ± SD, n=5 (*, p < 0.05; **, p < 0.01, FDR-adjusted).

