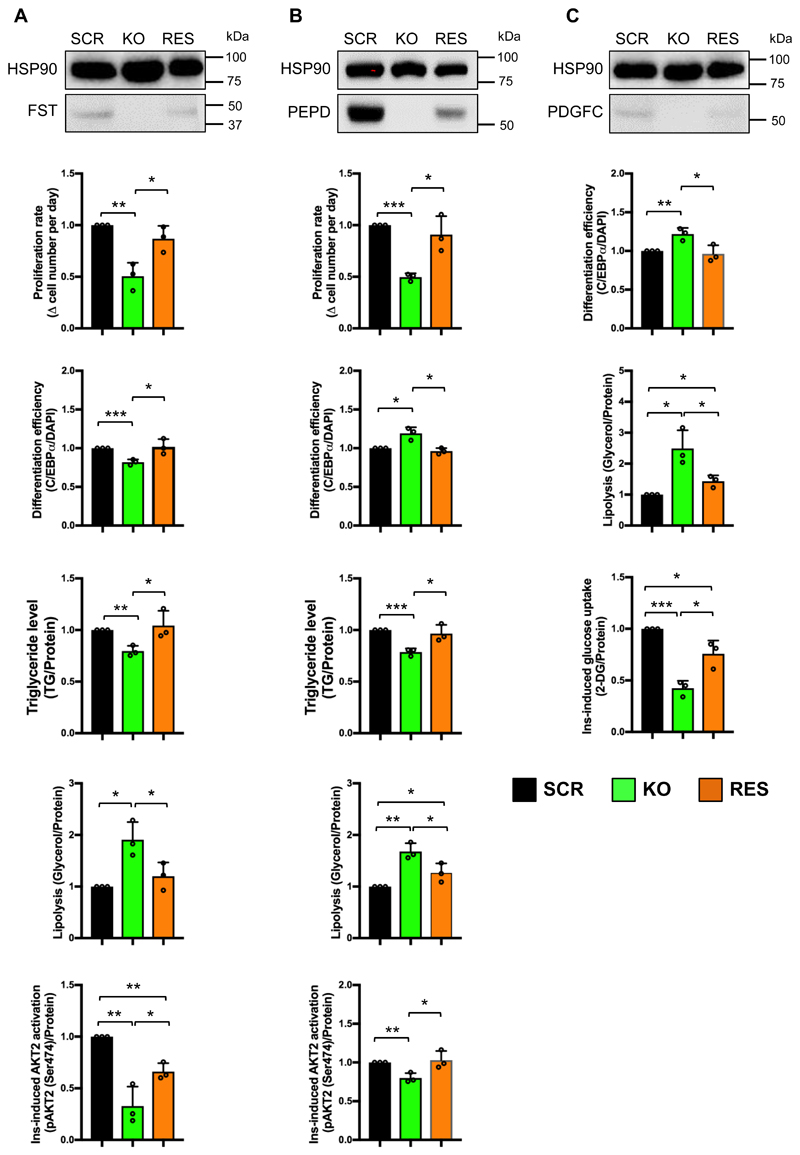
Figure 7. Phenotypic rescue in knockout lines of FST (A), PEPD (B) and PEGFC (C).
SCR, KO and RES indicates respectively: SCR cell line overexpressing GFP, respective KO cell line overexpressing GFP, and the respective KO cell line reconstituted with exogenous transcript. WB images indicate protein level in each cell line. Bar graphs display the phenotypic rescue in KO-cells compared to SCR and KO cells overexpressing GFP transcripts. All data are presented as mean ± SD, n=3 (*, p < 0.05; **, p < 0.01, ***, p < 0.001).

