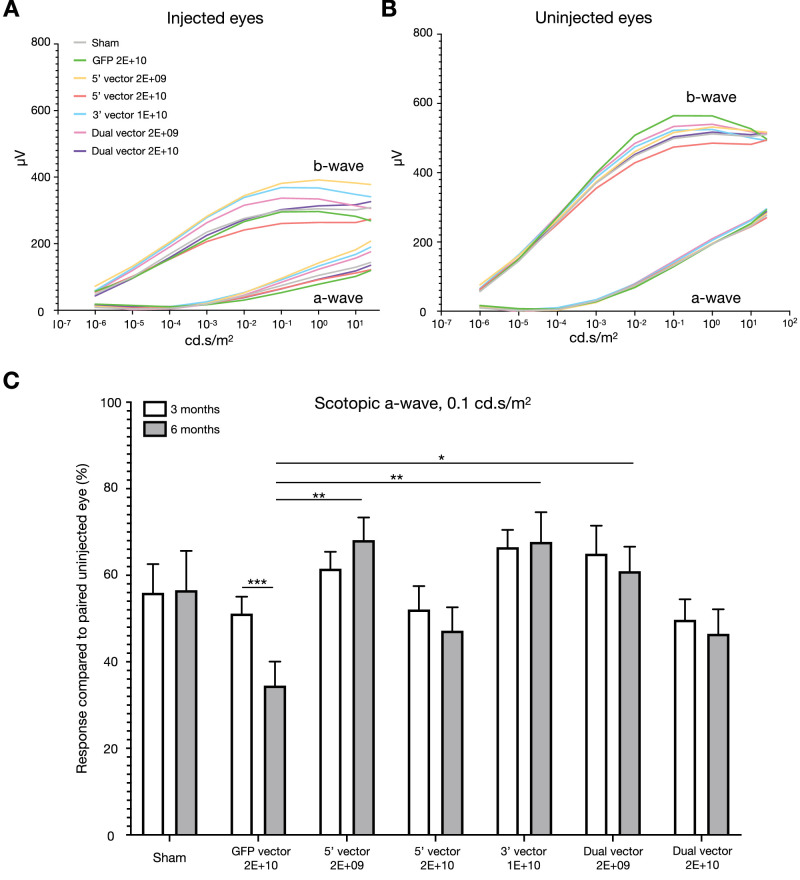
Figure 3.
ERG response data 6 months after injection. Smoothed average scotopic a- and b-wave response curves are shown for injected (A) and uninjected (B) eyes for all cohorts. (C) Scotopic a-wave responses at 0.1 cd.s/m2 were maintained in injected eyes compared with uninjected eyes between 3 and 6 months after injection except for the GFP cohort (repeated measures two-way analysis of variance, injection material P = 0.0200, time point P = 0.0695, interaction P = 0.0095). For the GFP-injected mice, there was a significant reduction in the response of the injected eye between 3 and 6 months after injection (Sidak's multiple comparisons; P = 0.0007). The GFP cohort responses were also significantly different to other cohorts at 6 months after injection (Tukey's multiple comparisons, 5′ vector 2E+09; P = 0.0019; 3′ vector 1E+10; P = 0.0035, dual vector 2E+09; P = 0.0315). For datasets A and B: sham = 11, GFP = 10, 5′ vector 2E+09 = 10, 5′ vector 2E+10 = 10, 3′ vector = 8, dual vector 2E+09 = 9, and dual vector 2E+10 = 10. For dataset C, only mice for which the 3- and 6-month data were available were included: sham = 11, GFP = 10, 5′ vector 2E+09 = 9, 5′ vector 2E+10 = 8, 3′ vector = 8, dual vector 2E+09 = 9, and dual vector 2E+10 = 10.

