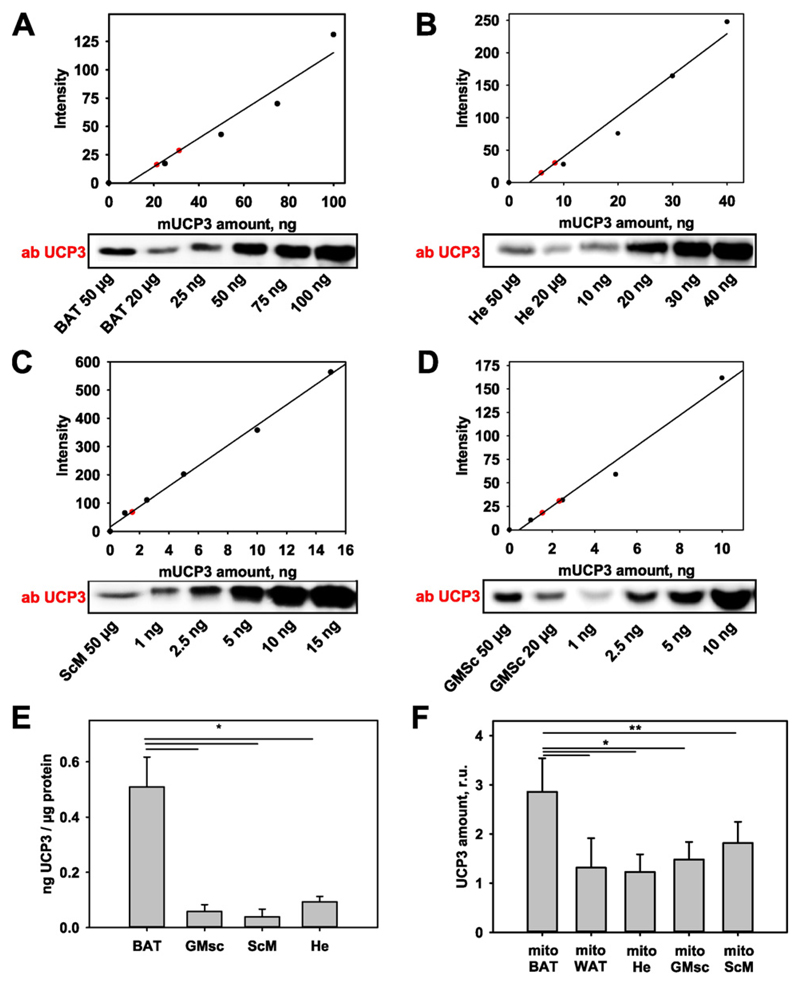
Fig. 2. Protein quantification in tissues expressing UCP3.
(A–D) Representative WBs for UCP3 quantification in BAT (A), He (B), ScM (C) and GMsc (D) in wt mice under physiological conditions. 20 μg and 50 μg of total protein from the investigated tissue (red circles) and different concentrations of recombinant UCP3 (mUCP3) were loaded for quantification. (E–F) Comparison of UCP3 amounts in different tissues (n = 4, E) and in isolated mitochondria (n = 7) of wt mice (F).

