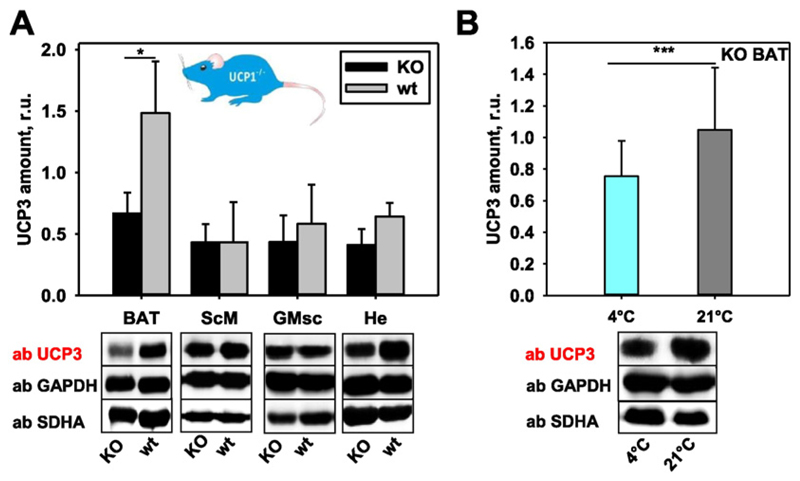
Fig. 4. Representative Western blots and quantification showing UCP3 expression in UCP1−/− mice.
(A) UCP3 expression in brown adipose tissue, skeletal muscles (ScM, GMsc) and heart of UCP1−/− mice compared to their wild type controls (wt). Data are presented as a mean values from three mice ± SD. (B) UCP3 expression in BAT of UCP1−/− mice housed at different temperatures. The relative amount (r.u.) of UCP3 is a ratio between the band intensity of standard (mUCP3, 5 ng) and sample. 25 μg of total protein from tissues were loaded per lane. The number of tested mice was n = 5 at 4 °C and n = 4 at 21 °C.

