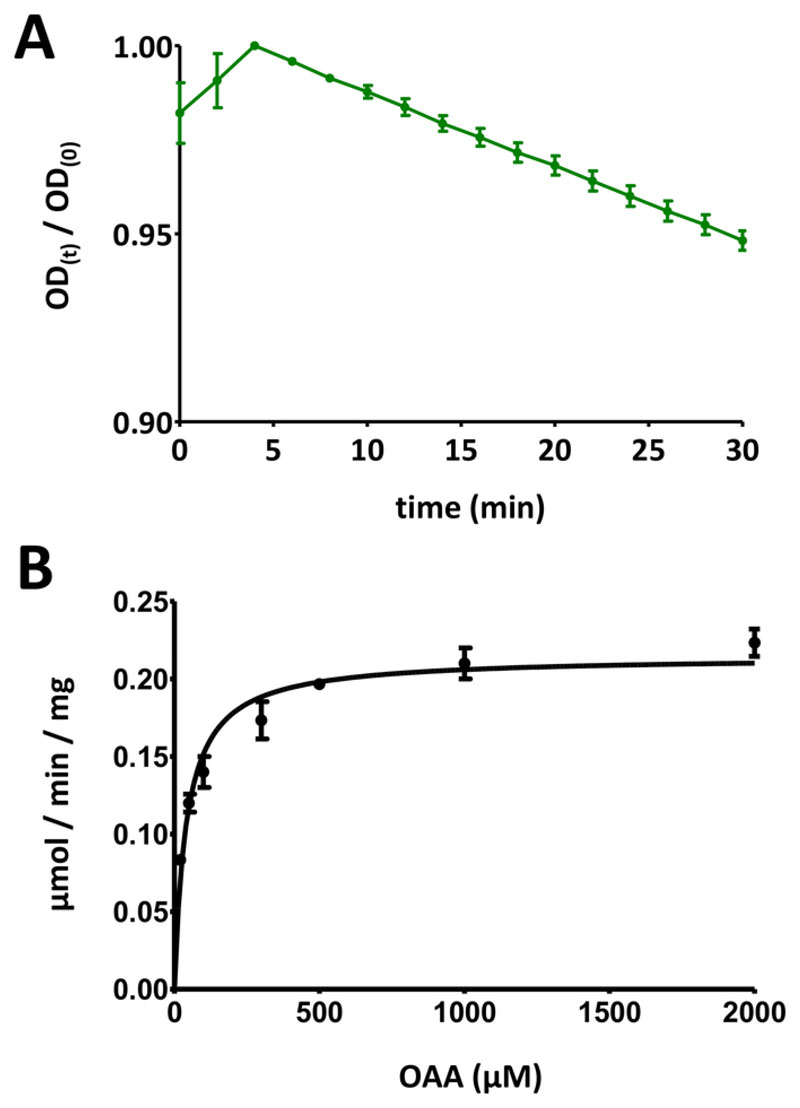
Figure 5. Exemplary results of enzyme assays.
(A) An exemplary UV absorption curve obtained for basic substrate-based FAHD protein enzyme assays (normalized into the range of 0 to 1) with standard deviation. The optical density (OD) ratio [OD(t)/OD(0)] at any given time t [OD(t)] is normalized to the initial OD [t = 0; OD(0)]. See section 7 of the protocol for more details. (B) Exemplary Michaelis-Menten kinetics of the human FAHD1 protein with standard deviation. See section 8 of the protocol for more details. Please click here to view a larger version of this figure.

