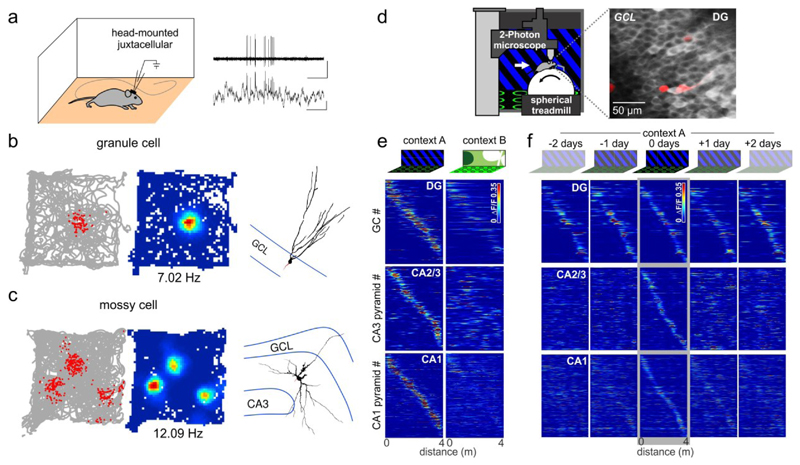
Fig. 2. Spatial, contextual and temporal firing characteristics of identified dentate gyrus neurons.
a | Schematic of juxtacellular recordings in freely moving rats and recorded signals (right). b | Left, Spikes of a granule cells (GC; red dots) plotted over the rat’s trajectory (grey line). Middle, heat-map plotting the firing frequency of this GC. Number indicates the maximum firing rate. Right, The GC was filled with neurobiotin after the recording to reconstruct the depicted morphology. c | As in b, but for a mossy cell. d | Schematic of a two-photon imaging setup for calcium imaging of DG neurons in head-fixed mice. The mice run on a treadmill to navigate along a virtual linear track displayed on monitors around them. Right, Fluorescence of a genetically encoded calcium indicator (GCaMP6f) expressed in GCs acquired in vivo. e | Mean activity (color-coded) of individual hippocampal place-cells (rows) plotted over distance on two visually different virtual linear tracks (context A and context B, respectively). The sorting of neurons is the same in both columns. A shift of place fields away from the central diagonal in the right plot signifies global remapping of the respective neuron. f | The same place cells were imaged over multiple days while the mouse ran on the same linear track on each day. Neurons were sorted by their place-fields on day 0 and this sorting is maintained for the other days shown. Note, GC place fields remain in the same location, whereas those of CA3 and CA1 cells change between days. GCL, Granule cell layer. Parts a-c are adapted from REF.41. Parts d-f are adapted from REF. 43.

