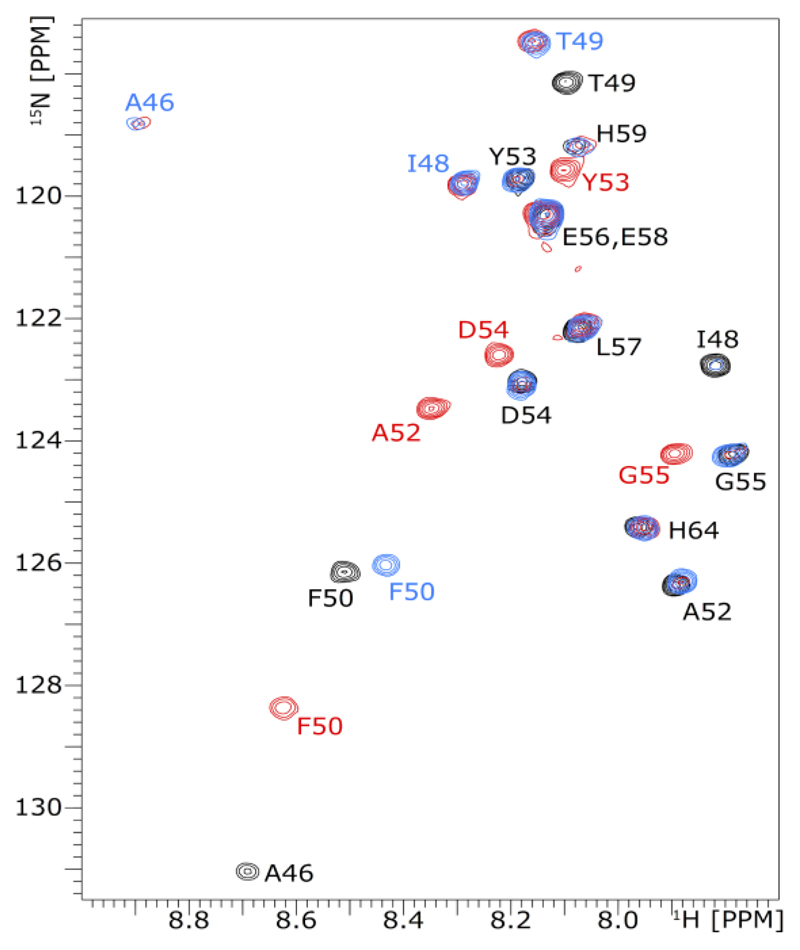
Figure 4. NMR experiment tracing the oxidation of leaderless PatE2K-2het.
1H–15N HSQC spectra were recorded for doubly heterocyclized, leaderless PatE2K (black) and after it was reacted with ArtGox for 20 min (blue) and 16 h (red). Cross-peaks are annotated with their residue sequences like those of the full-length substrate; the color of a label corresponds to the spectrum where the cross-peak it designates first appears. Note the cross-peaks for A46 and G55 after 20 min and 16 h are aliased in the 15N dimension; the actual 15N chemical shifts for these signals are 133.8 and 109.3 ppm, respectively.

