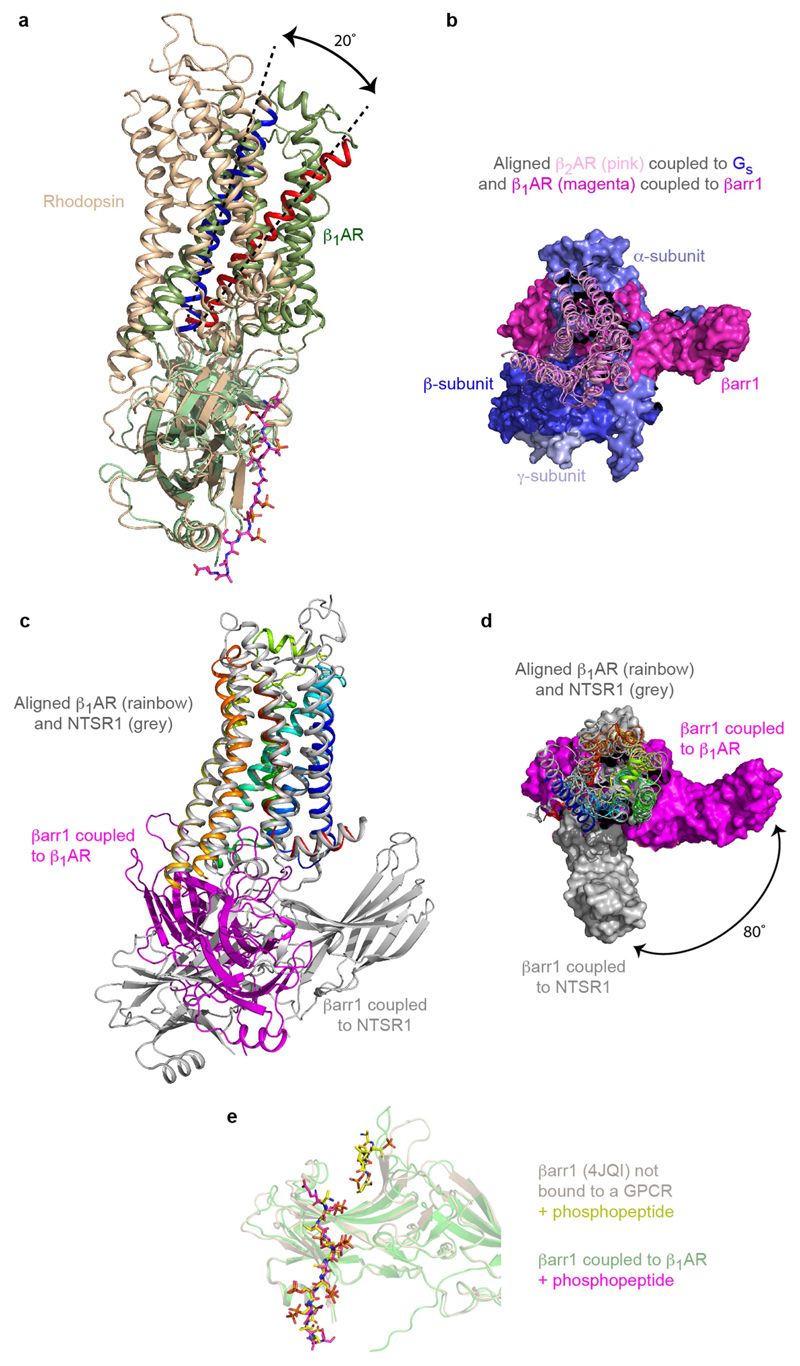
Extended Data Fig. 6. Comparison of arrestin coupled to different GPCRs.
a, Superposition of arrestin molecules in the complexes of β1AR6P–βarr1 (green) and rhodopsin–arrestin (pale brown). The different angle between the respective receptors and coupled arrestins is shown by the 20° difference in tilt of H3 (blue, H3 in rhodopsin; red, H3 in β1AR). b, Superposition of β1AR6P and β2AR (pink and purple cartoons, respectively) coupled to either βarr1 (magenta surface) or Gs (blue and purple surfaces), respectively. c, Superposition of β1AR6P (rainbow cartoon) and NTSR1 (grey cartoon) coupled to βarr1 (magenta) and βarr1 (grey), respectively. d, Alignment in c viewed from the membrane surface and the respective molecules of βarr shown in surface representation. e, Superposition of the active state of βarr1 (pale brown; PDB ID: 4JQI) not bound to receptor and βarr1 (green) coupled to β1AR6P. The phosphopeptides are shown as sticks: yellow carbon atoms, V2Rpp in 4JQI; magenta carbon atoms, V2R6P in the β1AR6P–βarr1 complex.

