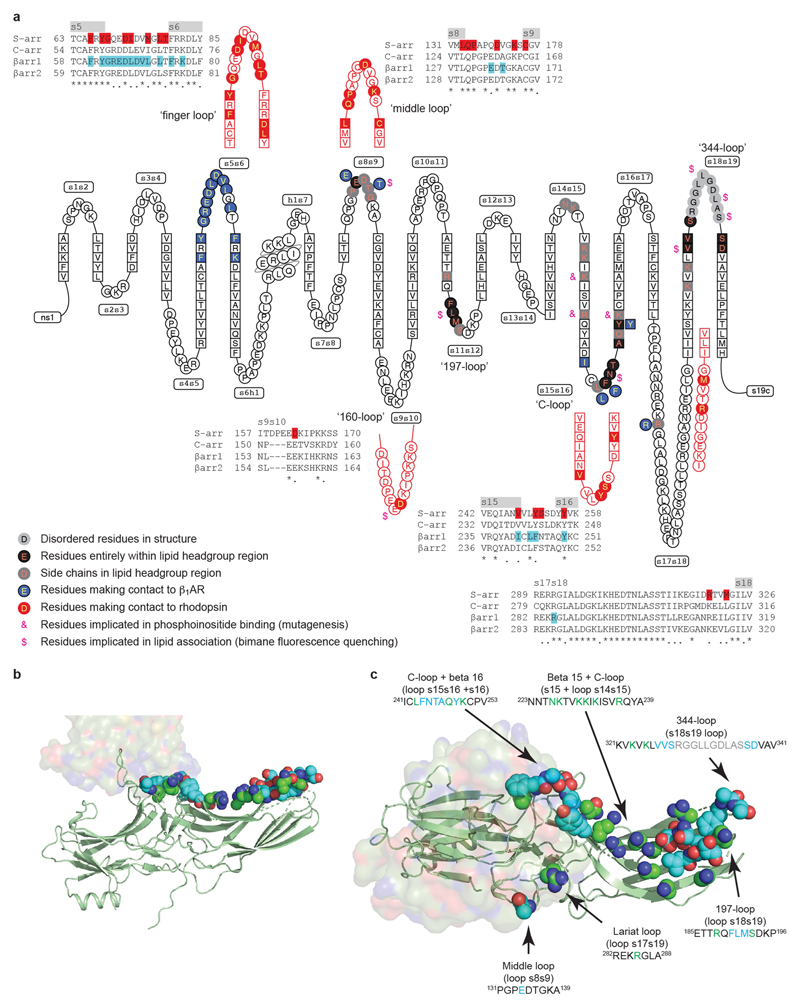
Extended Data Fig. 8. Comparison of the visual arrestin and βarr1 interfaces with GPCRs and lipids.
a, A snake plot (GPCRdb) of human βarr1 depicts the secondary structure elements in the protein, with amino acid residues that make contact with β1AR coloured blue. Equivalent regions in mouse visual arrestin (S-arr) that make contact to rhodopsin are shown in red. Alignments of human arrestins show the variation of amino acid sequences within these specific regions, with residues that make contact to the respective receptors highlighted. Highlighted are residues equivalent to those in visual arrestin that have been shown by mutagenesis to interact with phosphoinositides by mutagenesis (&)31 or to interact with the lipid bilayer by bimane fluorescence quenching ($)28. b, c, β1AR6P is depicted in surface representation and βarr1 as a cartoon (green) with atoms predicted to be within the head group region of the lipid bilayer shown as spheres: oxygen, red; nitrogen, blue; carbon, green or cyan. Residues coloured cyan are predicted to be entirely within the lipid head group region, while the carbons coloured green are the portions of these side chains that are potentially interacting with lipid head groups. b, c, View of the lipid-interacting surface viewed parallel to the membrane plane (b) and through the receptor (c).

