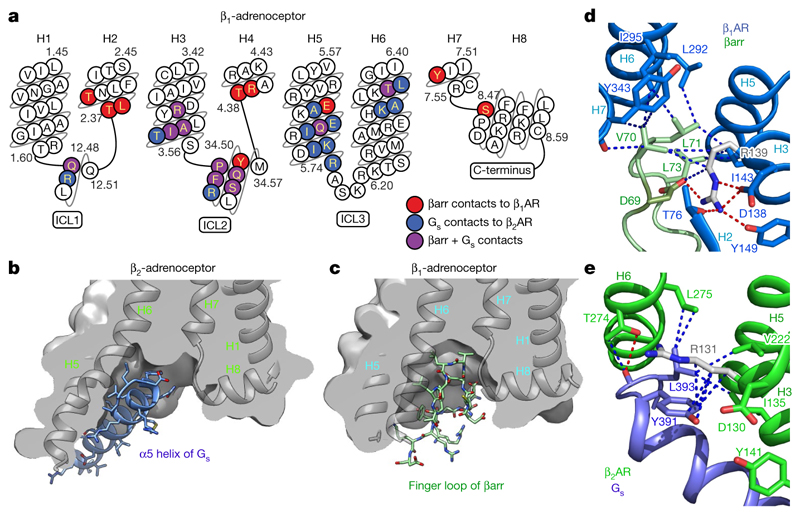
Fig. 3. Comparison of the receptor-coupling interfaces in the β1AR6P–βarr1 and β2AR–Gs complexes.
a, Snake plot of the intracellular region of turkey β1AR with amino acid residues colour-coded according to interactions: red, contact between β1AR6P and βarr1; blue, contact between β2AR and Gs; purple, both contacts. b, c, Cross-sections through the intracellular halves of β2AR (b) and β1AR6P (c) to highlight the different shapes of the intracellular cleft formed upon coupling of βarr1 compared with Gs. Transmembrane helices are shown for orientation, and are in front of the cross-section. d, Detail of the interface between the βarr1 finger loop (pale green) and β1AR6P (pale blue). e, Detail of the interface between the α5 helix of the Gs α-subunit (blue) and β2AR (green). Depicted in d, e are polar interactions (red dashes), van der Waals interactions (blue dashes; atoms ≤ 3.9 Å apart) and Arg3.50 (shown as sticks: carbon, grey).

