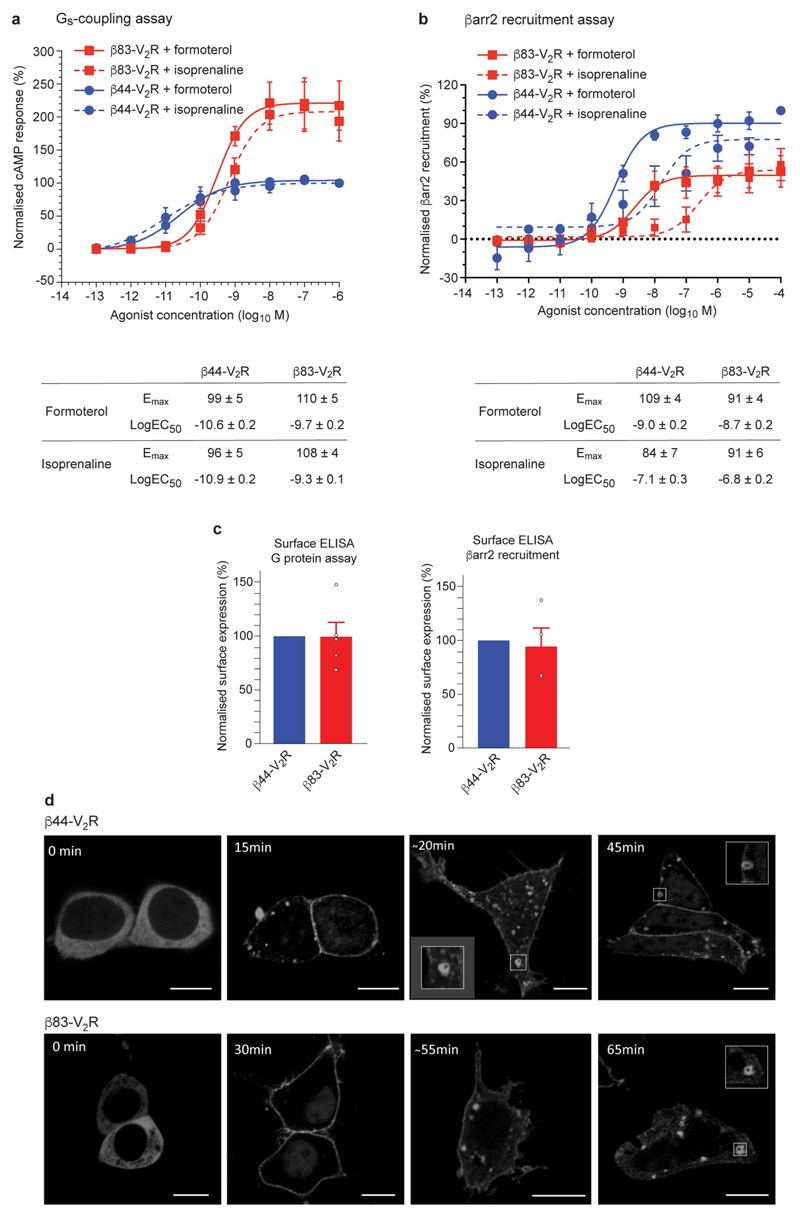
Extended Data Fig. 2. Functional characterization of β1AR construct β83 in cells.
a, HEK293 cells expressing the two β1AR constructs β44–V2R (blue circles) and β83–V2R (red squares) together with the cAMP sensor 22F (GloSensor assay) were stimulated with the indicated concentrations of isoprenaline (dashed line) or formoterol (solid line). Subsequently, the luminescence readings were recorded and normalized with respect to the signal at the maximal dose of isoprenaline for β44–V2R (treated as 100%). The results are from four independent experiments of duplicate measurements, data are mean ± s.e.m. The maximum effect (E max) and half-maximal effective concentration (EC50) were calculated by nonlinear regression (GraphPad Prism), data are mean ± s.e.m. b, HTLA cells expressing the β44–V2R (blue circles) and β83–V2R (red squares) Tango assay constructs (Methods) were stimulated with indicated concentrations of isoprenaline and formoterol, and the luminescence readings were recorded 8 h post-stimulation. Afterwards, the data were normalized with respect to the signal at the maximal dose of isoprenaline for β44–V2R (treated as 100%). Results are from five independent experiments of a duplicate measurement, data are mean ± s.e.m. E max and EC50 values were calculated by nonlinear regression (GraphPad Prism), data are mean ± s.e.m. c, Surface expression of β44–V2R and β83–V2R constructs in cells used for assays in a, b were measured by whole-cell ELISA using anti-Flag M2 antibody. Data are normalized with respect to β44–V2R (blue bars; treated as 100%). Values for p83–V2R are as follows: ELISA for G-protein assay, 99% ± 13% (n = 5); ELISA for arrestin assay, 94% ± 17% (n = 4). Experiments were performed in duplicate with the number of independent experiments indicated (n), data are mean ± s.e.m. d, HEK293 cells expressing β44–V2R and β83–V2R together with βarr1–mYFP were stimulated with 100 µM formoterol for the indicated times and the localization of βarr1–mYFP was monitored using live-cell confocal microscopy. Representative images from three independent experiments are shown. Scale bars, 10 µm.

