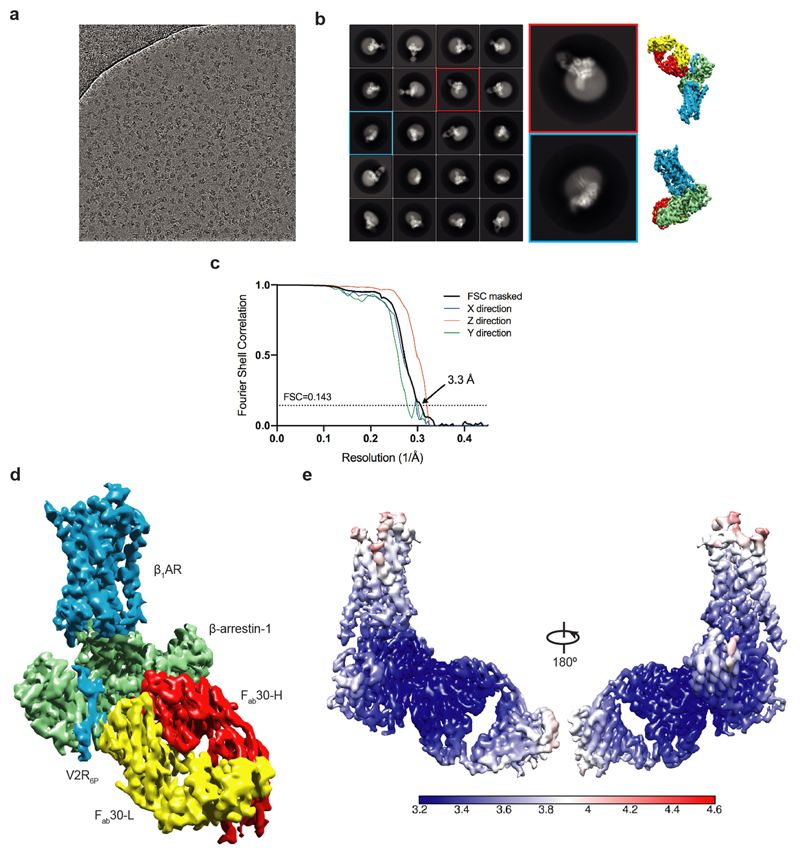
Extended Data Fig. 3. Cryo-EM single-particle reconstruction of the β1AR–βarr1‒Fab30 complex.
a, Representative micrograph (LMB-Krios2, magnification 105,000×, defocus –1.9 µm) of the β1AR6P–βarr1–Fab30 complex collected using a Titan Krios with the GIF Quantum K2 detector. b, Representative 2D class averages of the β1AR6P–βarr1–Fab30 complex determined using approximately 1 million particles after 3D classification. Copies of the final reconstruction are juxtaposed to indicate relative orientations. c, FSC curve of the final reconstruction (black) showing an overall resolution of 3.3 Å using the gold standard FSC of 0.143. The directional 3D-FSC curves calculated from the two half maps are shown in colour72. d, Final reconstruction coloured by polypeptides (contour level 0.023). e. Local resolution estimation of the β1AR6P–βarr1–Fab30 map as calculated by Relion.

