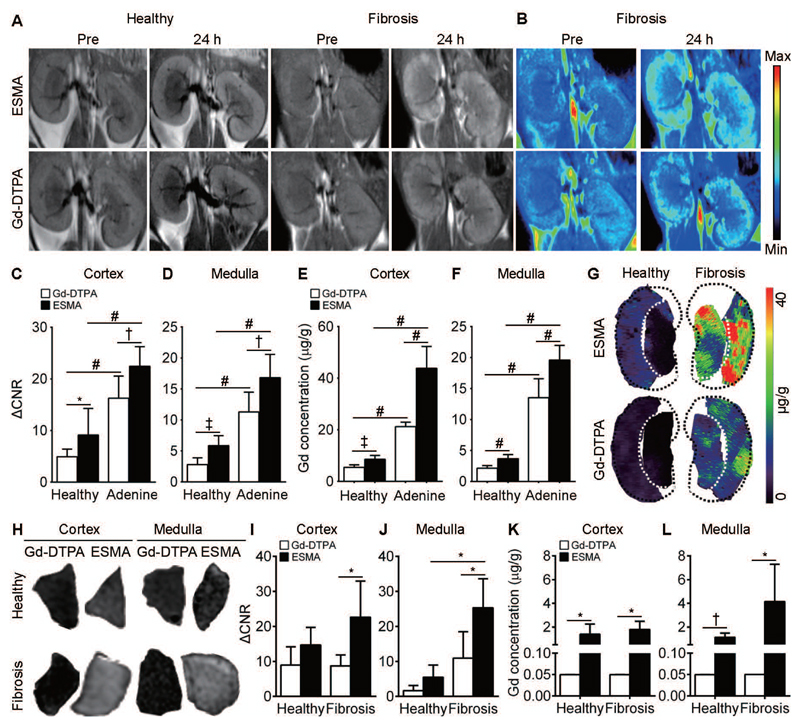
Fig. 3. Elastin imaging reflects renal fibrosis in adenine nephropathy and corresponds to elastin content in human kidney samples.
(A-G) Murine adenine nephropathy. (A) Coronal T1-weighted MR images and (B) pseudo color-coded images before and 24 h after i.v. injection of ESMA and Gd-DTPA in healthy (n=4) and adenine-induced fibrotic (n=4) kidneys. (C, D) Quantification of normalized MRI signal intensities in cortex and medulla of ESMA- and Gd-DTPA-injected mice with healthy and fibrotic kidneys. (E, F) Gd quantification in cortex and medulla of healthy and fibrotic kidneys. (G) Gd distribution by LA-ICP-MS in healthy and fibrotic kidneys of mice with ESMA or Gd-DTPA. (H-L) Human kidney fibrosis. (H) Representative T1WI images of gelatin-embedded human kidney biopsies after incubation with ESMA or Gd-DTPA. (I, J) Quantification of normalized MR signal intensities in ESMA- and Gd-DTPA-incubated healthy (n=4) and fibrotic (n=4) kidneys. (K, L) Gd quantification is reflective of ex vivo binding of ESMA in healthy and fibrotic human kidneys. ΔCNR: Δ contrast-to-noise ratio. *P < 0.05, † P < 0.01, ‡ P < 0.001, # P < 0.0001, t test.

