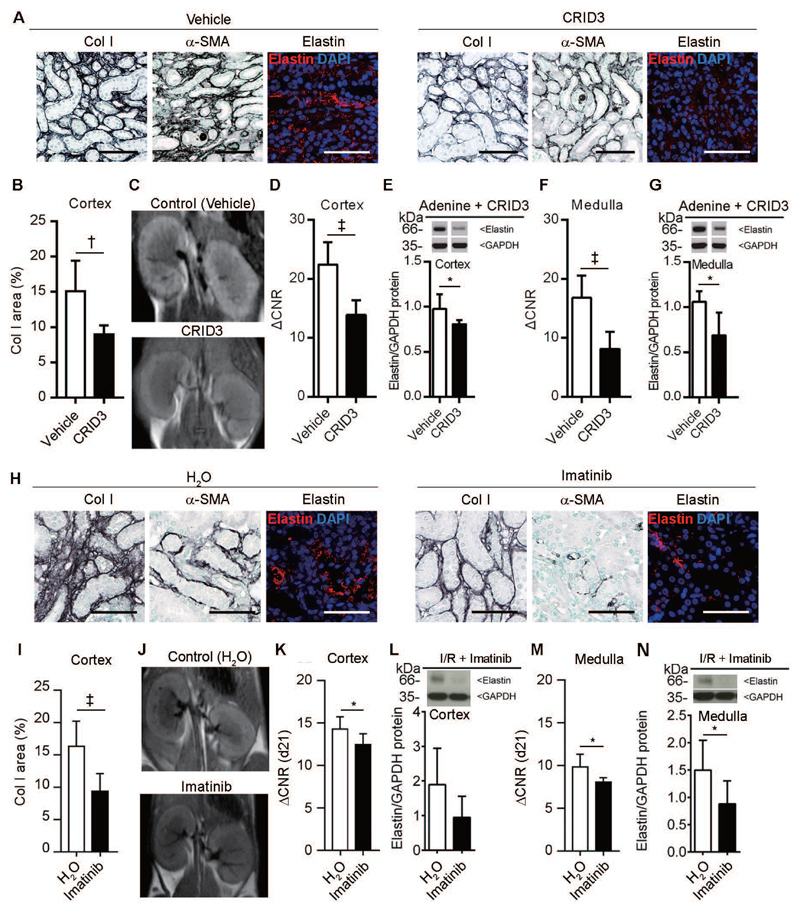
Fig. 6. Elastin imaging enables monitoring of anti-fibrotic therapy response.
(A) Representative immunohistochemical and immunofluorescent staining of collagen I, α-SMA, and elastin in kidneys from vehicle (n=4) and CRID3-treated (n=3) mice with adenine-induced nephropathy. (B) Quantification of collagen I expression in the cortex of vehicle- and CRID3-treated kidneys. (C) MR images of kidneys obtained 24 h after the i.v. injection of ESMA in vehicle- and CRID3-treated mice. (D-G) Quantification of the MRI signal intensities and protein expression in the cortex (D, E) and medulla (F, G) of vehicle- and CRID3-treated mice. (H) Immunohistochemical and immunofluorescent staining of collagen I, α-SMA, and elastin in water-(n=8) or imatinib-treated mice (n=8) after I/R-induced fibrosis. (I) Quantification of collagen I expression in the cortex of water- and imatinib-treated mice. (J) MR images obtained 24 h after ESMA injection in water- and imatinib-treated mice. (K-N) Quantification of the MRI signal intensities and protein expression in cortex (K, L) and medulla (M, N) of imatinib-treated vs. vehicle treated mice. Scale bar: 50 μm. ΔCNR: Δ contrast-to-noise ratio. *P < 0.05, † P < 0.01, ‡ P < 0.001, t test. Mann-whitney test in Elastin protein in CRID3 and ACNR in imatinib treated mice.

