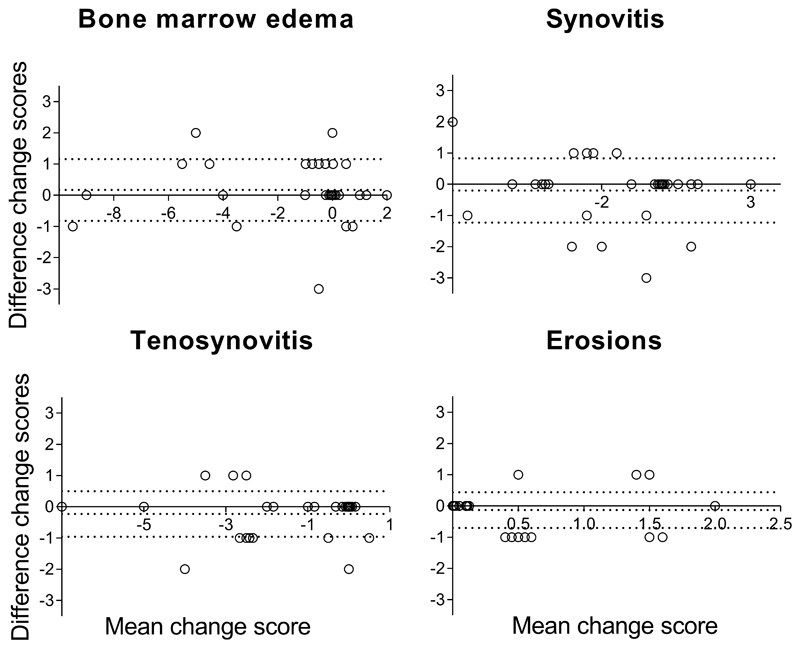
Figure 3. Bland-Altman plot depicting interreader agreement of change scores of the metatarsophalangeal-joints in early arthritis patients (n=30) from baseline until 12 months of follow-up.
Bland-Altman plots of assessment of agreement of change scores of the two readers. The Y-axes demonstrates the difference in the change scores (12 months minus baseline score) for reader 1 minus reader 2. The X-axes denotes the average change score between the two readers ((change score reader 1 - change score reader 2)/2). The middle dotted line depicts the mean difference, the upper and lower dotted lines depict the ±95% limits of agreement. From left to right and top to bottom the following MRI-lesions are depicted: bone marrow edema (BME), synovitis, tenosynovitis and erosions.

