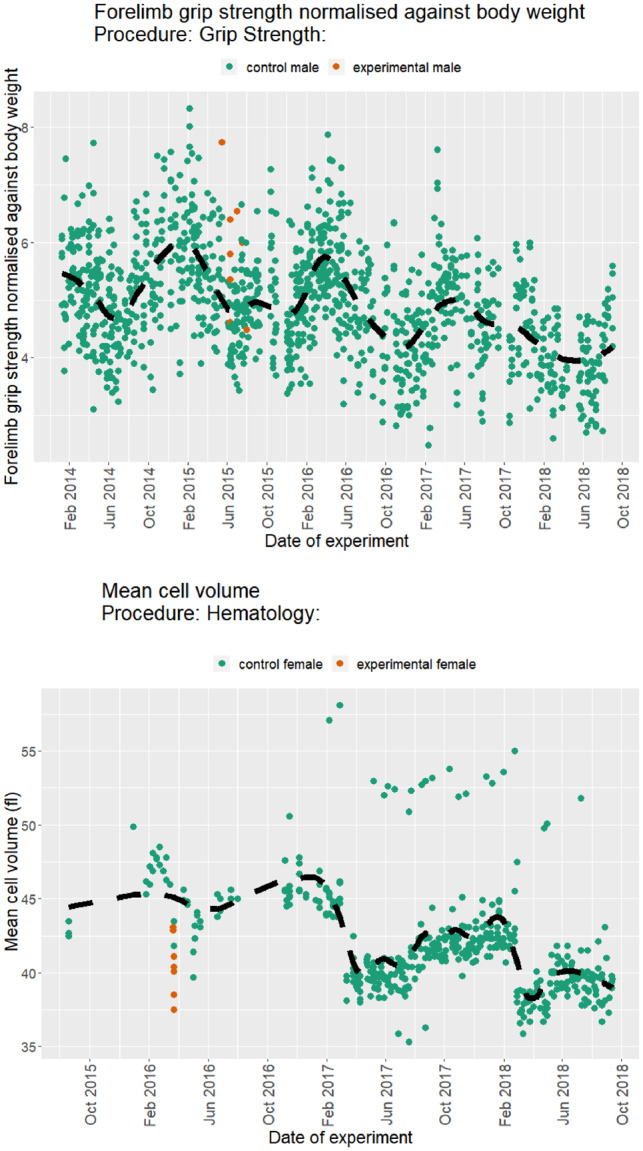
Fig. 1.

Examples of longitudinal data from the IMPC selected for high variance in control population. Scatter plot of the Forelimb grip strength normalized against body weight (top) and mean cell volume (bottom) from the IMPC Grip Strength and Haematology procedures, respectively. The dashed black lines represent the overall trend of the controls (dark green). Mutant mice are in orange
