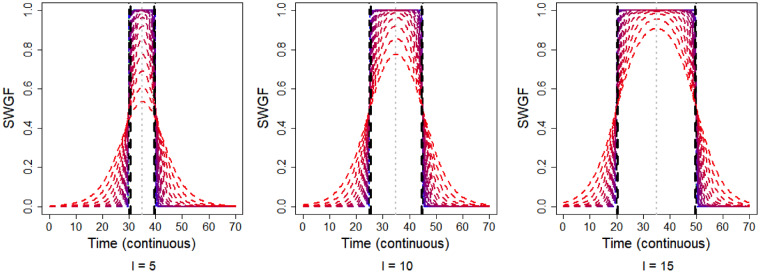
Fig. 2.
Behaviour of the symmetric weight generating function (SWGF) for a spectrum of values for the shape parameter, , ranging from (blue) to (red), in intervals of , and for the different values of the bandwith (left to right). The black dashed lines show the hard windows corresponding to . The grey dotted vertical lines show the window peaks. These plots show the capability of the WGF to generate different forms of the window

