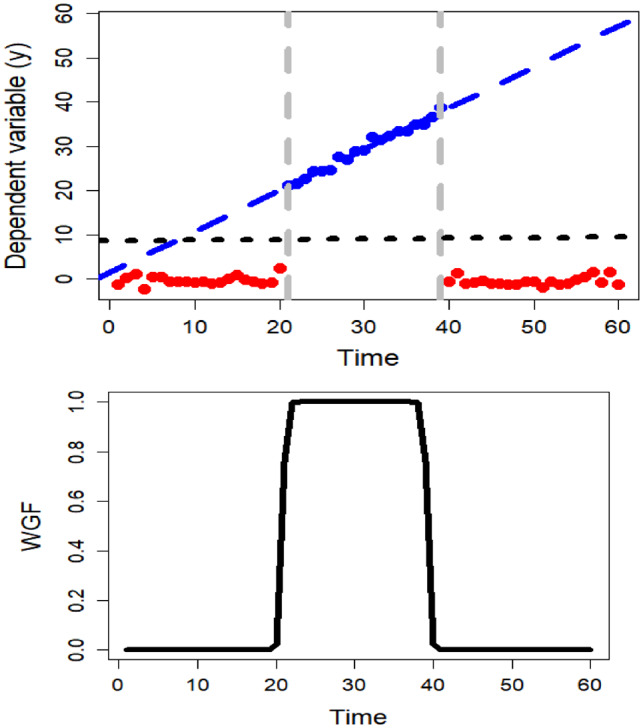
Fig. 4.

(Left) Comparison between the inferences from the windowed linear regression on the simulated data (blue dashed line) and without windowing (dotted black line). (Right) The corresponding weights from WGF centred on . With windowing, we attempt to model the effective section of the data (blue dots)
