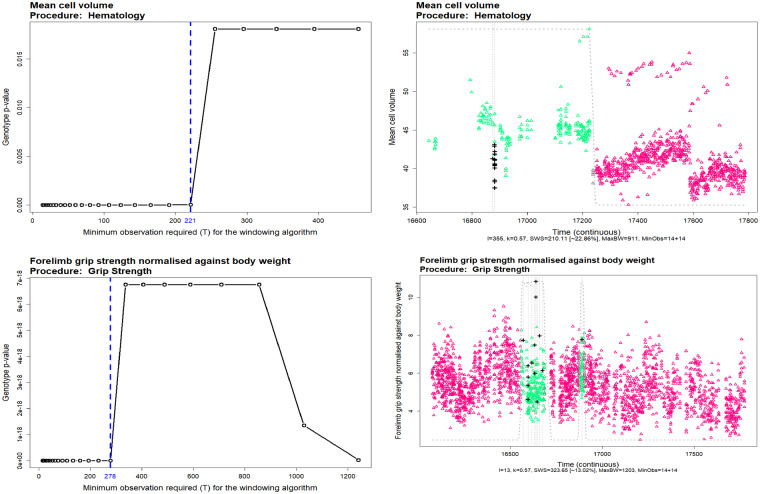
Fig. 5.
The sensitivity analysis of the soft windowing approach to the minimum observation required in the window. The left plots show the variation of the final Genotype P-values with different values of . The vertical dashed blue lines show the maximum toleration of the algorithm before including too much noise in the final fittings. The right plots show the optimal soft-windowed linear mixed model fitted to the data. The controls (triangles) weight are colour coded from green (inside the windows) to grey (on the window borders) and purple (outside the window). The mutants are shown with the black plus () on the plots

