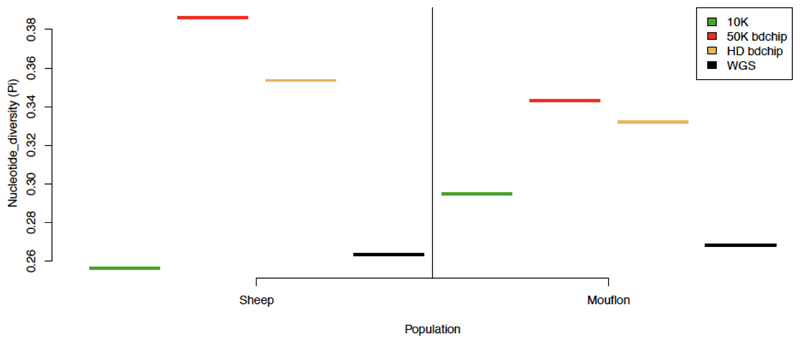
Figure 4. Nucleotide diversity (π) estimated in two Ovis groups with random and commonly used panels of variants.
Plot of Nucleotide diversity (π) estimated with a random set of 10K variants sampled in sheep data (10K), and with Illumina® ovine 50K SNP Beadchip (50K.Chip), Illumina® ovine HD Beadchip (HD.Chip), and variants extracted from whole genome sequences (WGS).

