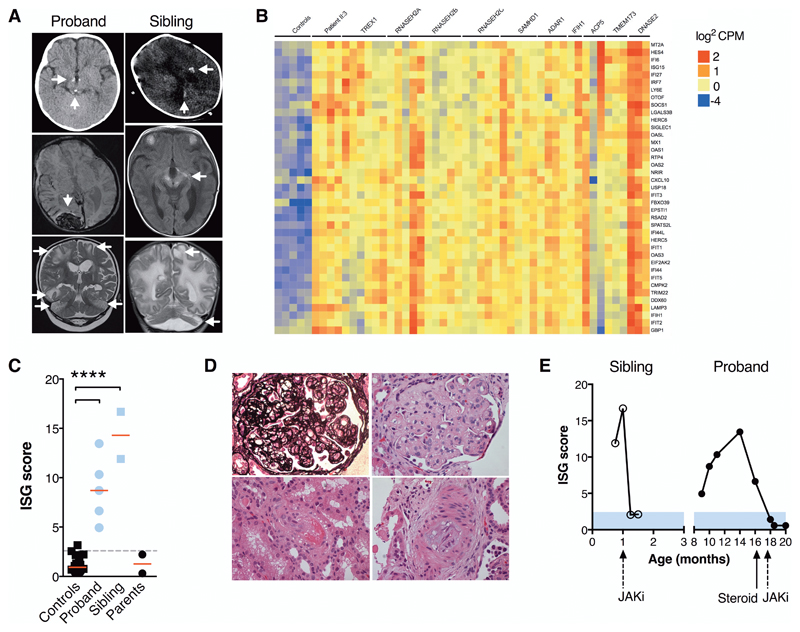
Fig. 1. Neurological and systemic disease associated with excessive IFN activity.
(A) Neuroimaging demonstrating calcifications (brainstem/hypothalamus [proband II:3, top panel]; cerebral white matter/basal ganglia/midbrain/optic tract [sibling II:4, top and middle]); hemorrhages (occipital/subdural/subarachnoid [proband II:3, middle]); cerebral white matter and cerebellar signal abnormality with parenchymal volume loss (both, bottom), accompanied by focal cystic change and cerebellar atrophy (sibling II:4). (B) Whole blood RNA-seq interferon stimulated gene profiles: controls (n=5); proband II:3 (n=4); patients with mutations in: TREX1 (n=6); RNASEH2A (n=3); RNASEH2B (n=7); RNASEH2C (n=5); SAMHD1 (n=5); ADAR1 (n=4); IFIH1 (n=2); ACP5 (n=3); TMEM173 (n=3); DNASE2 (n=3). (C) Interferon scores (RT-PCR) of patients, parents and n=29 healthy controls. **** P<0.001, ANOVA with Dunnett’s post-test. (D) Renal histopathology in proband (x 400 magnification) showing thrombotic microangiopathy with extensive double contouring of capillary walls (silver stain, upper left panel), endothelial swelling, mesangiolysis and red cell fragmentation (upper right), arteriolar fibrinoid necrosis (lower left) and myxoid intimal thickening of an interlobular artery (lower right, all H&E). (E) Transcriptional response to JAK inhibitor (JAKi) ruxolitinib in both patients (RT-PCR).

